
Cyanobacterial crowding-out effects on metabolite partitioning: modeling 2-methylisoborneol (MIB) release dynamics and implications
Revision Note
# These authors contributed equally to this work.
a Key Laboratory of Environmental Aquatic Chemistry, State Key Laboratory of Regional Environment and Sustainability, Research Center for Eco-Environmental Sciences, Chinese Academy of Sciences., Beijing 100085, China.
b Bureau of Hydrology Information Center of Taihu Basin Authority, Shanghai 200434, China.
c College of Environmental Science and Engineering, Ocean University of China, Qingdao 266100, China.
d University of Chinese Academy of Sciences., Beijing 100049, China.
* Corresponding to: Ming Su (mingsu@rcees.ac.cn)
Response to Editor
- Thank you for your interest in the Journal of Hazardous Materials. I look forward to receiving your resubmitted manuscript.
Response/Action:
Thank you for the opportunity to revise our manuscript. We greatly appreciate the valuable suggestions and comments from you and the reviewers. We have carefully revised the manuscript according to the reviewers’ comments, and our point-by-point responses and actions are listed below.
Reviewer #1:
- This study focuses on a previously underexplored aspect of odorant dynamics: the intracellular and extracellular distribution and release processes of 2-methylisoborneol (MIB). By integrating laboratory culture experiments of two filamentous odor-producing cyanobacterial strains with field monitoring data from a natural lake, the authors developed a mechanistic model based on logistic growth and cellular crowding effects. This model effectively links cyanobacterial physiology to odor release potential and is applied to a real-world lake scenario. The study provides a solid foundation for early warning, decision-making, and targeted water treatment interventions. The work is novel, methodologically sound, and of clear practical relevance.
Response/Action:
Thank you very much for your positive feedback. We appreciate your recognition of the novelty of our work. We have carefully considered your detailed comments and made the revisions accordingly. We hope these revisions meet your expectations and address all concerns, enhancing the clarity and impact of the manuscript as your valued suggestions.
Specific comments
- Several language and formatting issues need to be addressed to improve clarity and professionalism. For example, in lines 98 and 234, “mechanical model” should be corrected to “mechanistic model” to better reflect the modeling of biological processes. In lines 26-27, the phrase “Application to Lake Taihu successfully reconstructed two odor events (2022-2023)” reads somewhat awkwardly and could be revised to: “Application of the model to Lake Taihu successfully reconstructed two odor events during 2022-2023.” Additionally, in line 338, the article “an” is incorrectly used before a consonant sound; it should be “a key indicator.”
Response/Action:
Thanks for your correction. We have revised the sentence and words as suggested.
- Between lines 96 and 104, the manuscript claims that the mechanistic model reveals MIB release patterns. Please explicitly outline in the Introduction the limitations of previous models or empirical laws, and specify how this study fills the knowledge gaps compared to existing literature (citing 2-3 key references).
Response/Action:
Thanks for your comments. We have made the following revisions based on your suggestions. Although numerous studies have investigated the degradation kinetics and removal processes of MIB, relatively little attention has been given to its intracellular versus extracellular distribution. This represents a critical knowledge gap, as extracellular MIB is particularly relevant for water treatment operations. To date, no study has provided a robust description of the spatiotemporal dynamics of intracellular and extracellular MIB, nor has the underlying mechanism of their variation been clearly elucidated.
Warning
Source of clab: r1q0201 is missing!
- Lines 31-36 suggest the model may be extended to other metabolites (e.g., geosmin, cyanotoxins). Given the distinct biosynthesis, cellular localization, and release mechanisms of different compounds, this claim should be tempered. The authors are encouraged to phrase the potential applicability cautiously, e.g., stating it “may apply” and outlining necessary conditions or future validation directions.
Response/Action:
Thanks for your correction. We have revised the sentence and words as suggested. The key condition to consider is that the release of this substance is primarily driven by cell death. Future research could verify, through laboratory cultivation experiments, whether the release of this substance correlates with the cell growth cycle.
- Lines 71-72 describe 2-MIB synthesis involving the “Sg Enc protein shell,” but this term is unclear. Please clarify what the “Sg Enc” structure is, in which organisms it is found, and provide relevant references or explanations.
Response/Action:
Thank you for highlighting the unclear term. We have made the following revisions based on your suggestions. Recent structural work showed that the protein designated Sg Enc is a Family 2B encapsulin shell that self-assembles into an icosahedral nanocompartment and encapsulates 2-methylisoborneol synthase (2-MIBS); thus, 2-MIB biosynthesis can be spatially compartmentalized within a protein shell in certain bacterial producers (e.g., Streptomyces griseus and related taxa)
Warning
Source of clab: r1q0401 is missing!
- Lines 192-194 (Fig. 1, Fig. S3) report monthly mean ± standard deviation (e.g., 40.0 ± 77.5 ng L⁻¹), but the SD is notably larger than the mean. Please provide sample sizes (n), median and interquartile ranges, or consider presenting boxplots to better illustrate data distribution.
Response/Action:
Thanks for your comments. We have added a table (Supplementary Table 3) in the supporting materials.
- Lines 198-204 (Fig. S1) refer to four clusters identified among 31 sampling sites. Please detail the clustering method used, including the algorithm, distance metrics, and criteria for selecting the number of clusters (k).
Response/Action:
Thank you for this important comment. The clustering was performed using hierarchical clustering of log-transformed tMIB concentrations (rows = 31 sites, columns = months). Euclidean distance was used as the distance metric, and complete linkage was applied as the agglomeration method. The dendrogram suggested 4–5 possible groups; we selected k=4 based on cluster stability and ecological interpretability. The four clusters correspond to spatially coherent regions of Lake Taihu (West, Center, Southeast, and North).
Warning
Source of clab: r1q0601 is missing!
- Lines 29, 315, and 410 show inconsistent units regarding photosynthetic photon flux density (μmol photons m⁻² s⁻¹) and daily photosynthetic energy (mol m⁻² d⁻¹). This may cause confusion. Please clearly annotate the light intensity units and provide conversion relations where applicable.
Response/Action:
Appreciate your careful observation. Specifically, photosynthetic photon flux density (PPFD) is expressed in μmol photons m⁻² s⁻¹, while daily photosynthetic energy (daily light integral, DLI) is expressed in mol photons m⁻² d⁻¹. We have now explicitly annotated the units in the text and figure captions. DLI = PPFD × 0.0864.
- Lines 262-268 (Fig. 4B) describe applying the laboratory logistic-based f model to Lake Taihu data. Please discuss the simplifications and assumptions made during this extrapolation, and their potential implications.
Response/Action:
Thanks for your comments. We have made the following revisions based on your suggestions. Field monitoring of algae has shown that Pseudoanabaena is the main odor-producing cyanobacterium. Therefore, when applying the model to Lake Taihu, we assume that MIB is solely produced by Pseudoanabaena. The algal growth stage data calculated for each sampling point represent the growth stage of the dominant odor-producing cyanobacteria at that location. Based on the growth stage distribution of odor-producing cyanobacteria, the odor risk at each sampling site can be further quantified and assessed.
Warning
Source of clab: r1q0801 is missing!
- Lines 158-165 mention that extracellular MIB (e_MIB) undergoes degradation, volatilization, or adsorption, which affect its measurement and interpretation. Does the manuscript consider the degradation rate of e_MIB in the modeling or data analysis?
Response/Action:
Appreciate your careful observation. In developing the model, we accounted for potential influences on extracellular MIB concentrations, including degradation, volatilization, adsorption, and accumulation, by introducing a β term as a correction factor. Additional details are provided in the Methods section for clarity.
Warning
Source of clab: r1q0901 is missing!
- Lines 292-294 refer to the probabilities of exceeding 10 ng L⁻¹ and 50 ng L⁻¹ MIB thresholds. Please provide details on how these probabilities were calculated.
Response/Action:
Thanks for your comments. We had briefly described the calculation method in Section 2.4 MIB Risk Assessment. As suggested, we have revised this section to include a more detailed description of the calculation procedure. A probabilistic statistical analysis was conducted between St and tMIB to determine the distribution of tMIB across different St intervals. The probability distribution of tMIB within each interval was calculated, and the expected value of tMIB for each group was then derived and used as the representative tMIB concentration for the corresponding St interval.
Warning
Source of clab: r1q1001 is missing!
- Lines 158-161 note that the model is currently based on only two odor-producing strains. The authors are encouraged to discuss the model’s applicability and limitations when extended to other cyanobacterial species or more complex natural bloom communities.
Response/Action:
Thanks for your comments. We have made the following revisions based on your suggestions. When applying the model to real-world aquatic systems, monocultures of odor-producing cyanobacteria are more suitable. In systems with mixed species of odor-producing cyanobacteria, it is challenging to accurately calculate the contribution of each species to the odor compounds, which limits the model’s applicability. Moreover, compared to controlled laboratory conditions, variations in meteorological factors and community interactions in natural environments may also impact the model’s performance. These aspects present opportunities for further model improvements in future studies.
Warning
Source of clab: r1q1101 is missing!
- Lines 28-29 and 323 report that both low and high temperatures correspond to increased risk. Please explain the biological or environmental contexts of these two seemingly opposite temperature risk zones and clarify how these threshold values were derived.
Response/Action:
Thanks for your comments. We have made the following revisions based on your suggestions. At a temperature of 15°C, odor-producing cyanobacteria can begin to grow, and with the absence of other competitors, there is a certain odor risk. In the Shanghai QCS Reservoir, located at the same latitude, an MIB outbreak caused by Pseudoanabaena was observed at the end of April. When the temperature rises to 30°C, odor-producing cyanobacteria gain a competitive advantage over traditional bloom-forming algae, resulting in an increased odor risk.
Warning
Source of clab: r1q1201 is missing!
- Lines 235-237 indicate significant differences in parameters α₁ and β between the two species (p < 0.01). Are these differences consistent across varying light intensities and nutrient conditions? Please elaborate on the ecological significance of these parameters.
Response/Action:
Thanks for your comments. We have made the following revisions based on your suggestions. Different light intensities and nutrient conditions do affect the parameter values, but the most significant influence comes from the differences between algal species. α₁ represents the coefficient between the rate of change in f with respect to cell density, indicating the impact of the crowding effect on the intracellular-extracellular distribution of MIB as the cell growth stage progresses, influenced by the cell growth rate. β represents the correction factor for MIB degradation or accumulation effects, and is related to the odor production efficiency of individual cells.
Warning
Source of clab: r1q1301 is missing!
- Lines 158-165 apply the Logistic growth model to represent crowding effects. Please explicitly state the key assumptions of this model (e.g., no immigration/emigration, constant nutrient and light conditions, absence of predation or viral effects) and discuss how violations of these assumptions might impact the results.
Response/Action:
Thanks for your comments. We have made the following revisions based on your suggestions. It is important to emphasize that the Logistic model relies on several key assumptions: (1) the algal population is treated as a closed system, meaning there is no significant immigration or emigration; (2) external environmental conditions remain relatively stable over the modeling time scale, such that variations in nutrients, light, and temperature do not significantly affect the growth dynamics, or their effects are averaged into the parameters; (3) biological processes such as predation, viral lysis, or other factors leading to abrupt population decline are negligible; (4) the population is treated as a homogeneous entity, with interspecies competition and physiological differences within the population ignored. These assumptions ensure that the model can effectively capture the density-dependent limiting effects in a simplified manner. However, in real aquatic environments, these assumptions are often difficult to fully satisfy. For example, water exchange may introduce new cells or dilution effects, and nutrient pulses or light fluctuations can lead to time-varying growth rates and environmental carrying capacities. In the future, to enhance the model’s applicability, further adjustments and optimizations may be necessary, such as introducing time-varying carrying capacity K(t), adding migration terms, or considering predation loss functions.
Warning
Source of clab: r1q1401 is missing!
Warning
Source of clab: r1q1402 is missing!
Reviewer #2:
Graphic abstract
- Explanation total MIB cannot be found in the figure. Check and revise.
Response/Action:
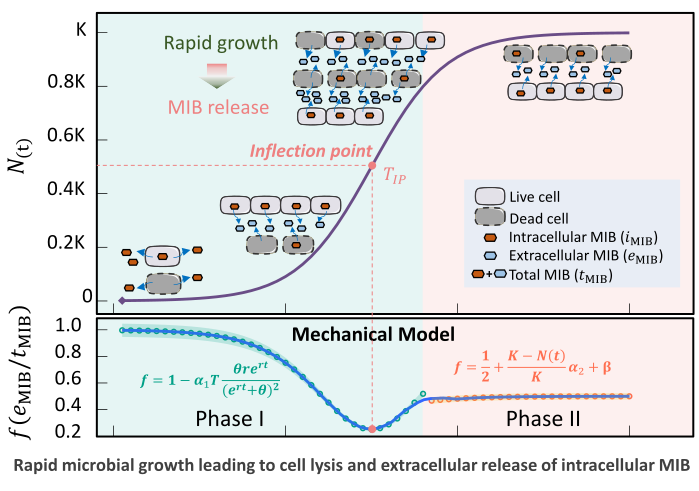
Thanks for your correction. Total MIB is defined as the sum of intracellular and extracellular MIB. Accordingly, we have revised the figure legend to clarify this definition.
Highlights
- Up to 85 characters per bullet point. Revise.
Response/Action:
Thank you very much for your suggestion. Accordingly, we have revised the Highlights as shown below.
Abstract
- Line 19: taste-and-odor -> taste and odor
Response/Action:
Thank you for the careful observation. The phrase “taste-and-odor” has been revised to “taste and odor” as suggested.
- Line 28: Remove ~
Response/Action:
Appreciate your comment. The unnecessary word has been removed accordingly.
Keywords
- Use alphabetical order.
Response/Action:
Appreciate your comment. The keywords have been reordered in alphabetical order as follows:
2-methylisoborneol (MIB); Cell lysis-mediated release; Drinking water early warning; Growth-phase dependent release; Taste and odor.
1. Introduction
- Line 43 ..one of the problematic compounds; line 45 even lower values can be found in literature; line 62-63 True
Response/Action:
Thanks for your comments. According to the suggestion, we revised the words and, based on the literature, adjusted the odor threshold value to 4–16 ng/L. Moreover, most water treatment plants currently monitor only total MIB, without considering the distribution between intracellular and extracellular fractions. This limitation may underestimate potential water quality risks, as extracellular MIB directly affects odor perception in finished water, while intracellular MIB can be rapidly released during cell lysis or treatment processes.
Warning
Source of clab: r2q0501 is missing!
- Present factors affecting microbial growth (temperature, eutrophication) and MIB production.
Response/Action:
Thanks for your comments. We have made the following revisions based on your suggestions.
Warning
Source of clab: r2q0601 is missing!
- At the end of introduction, clearly present the hypothesis and goal of the study.
Response/Action:
Thanks for your comments. We have made the following revisions based on your suggestions.
Warning
Source of clab: r2q0701 is missing!
2. M&M
- Line 117-123 Remove, not part of M&M
Response/Action:
Thank you very much for your suggestion. Accordingly, we have removed it.
- Explain why did you chose to monitor MIB, and not GSM or other compounds? Add to the text.
Response/Action:
Thank you very much for your suggestion. Compared with GSM, MIB has a lower molecular weight and tends to persist for a longer duration, making it more difficult for water treatment plants to remove. Consequently, odor issues caused by MIB are more widespread. As Lake Taihu is an important drinking water source, both compounds have been routinely monitored; however, GSM concentrations have consistently remained low, whereas MIB has shown increasing trends. Therefore, this study primarily focuses on MIB. In addition, the findings regarding the intracellular and extracellular distribution of MIB may also be applicable to GSM, which will be further validated in future research.
Warning
Source of clab: r2q0901 is missing!
2.1How samples were taken, which bottles were used etc. Explain thoroughly.
Response/Action:
Thank you very much for your suggestion. We have added detailed information on the types of bottles used during sampling and the procedures for sample preservation.
Warning
Source of clab: r2q1001 is missing!
Warning
Source of clab: r2q1002 is missing!
Warning
Source of clab: r2q1003 is missing!
- Line 138-141: Insufficient! Thoroughly explain method, equipment, manufacturer, column etc. and especially validation data to show LOD and LOQ. Any results are unusable without method data.
Response/Action:
Thank you very much for your suggestion. Following your suggestion, we have provided detailed information on the analytical method, instruments, manufacturer, and chromatographic column used. The limits of detection (LOD) and quantification (LOQ) for this method were determined to be 0.5 ng/L and 2.2 ng/L, respectively.
Warning
Source of clab: r2q1101 is missing!
2.3Which equipment, methods and programs were used for the modelling? Add.
Response/Action:
Thanks for your comments. Following your suggestion, we have provided detailed information on the equipment, methods and programs. The model was constructed on a Lenovo ThinkStation workstation(P350) running a Linux-based RStudio Server environment. All modeling procedures were based on self-developed formulas, which are described in detail in the Methods section. The complete code used for model construction is provided in the supplementary material.
Warning
Source of clab: r2q1201 is missing!
Warning
Source of clab: r2q1202 is missing!
- Microbial tests were not described at all. Should be clearly presented, add.
Response/Action:
Thanks for your comments. On request, we have added a description of microbial tests.
Warning
Source of clab: r2q1301 is missing!
3 Results
- Line 193-195 very high concentrations! Line 205-210 These are important findings.
Response/Action:
Thank you for your attention and comments. We acknowledge that the concentrations reported are indeed elevated, with the springtime average reaching approximately four times the regulatory limit. Nevertheless, such concentration levels have been relatively common during odor events in recent years. Regarding the findings described in the paper, we agree that they are of particular interest, and we sincerely appreciate your recognition of their significance.
- Especially
3.4and other sections of 3: Remove all discussion and move to section 4. Results here only!
Response/Action:
Thank you for your attention and comments. As suggested, we have carefully revised the text in both the Results and Discussion sections to improve clarity and consistency.
Warning
Source of clab: r1q0601 is missing!
Warning
Source of clab: r2q1502 is missing!
Warning
Source of clab: r2q1503 is missing!
Warning
Source of clab: r2q1504 is missing!
4 Discussion
- No results here. Remove fig. 7 and move to results.
Response/Action:
Thank you for your attention and comments. Figure 7 does not present experimental results, but rather a conceptual diagram intended to further interpret and illustrate the findings. We considered making adjustments; however, after thorough discussion among the authors, we concluded that it is more appropriate to retain this figure in the Discussion section.
- Overall, interesting study and results which should be presented and published. However, methods were poorly described with many important issues missing which suggest that the manuscript should be rejected as is. Additionally, goals and basis for the study should be more thoroughly presented.
References
Thank you for your attention and comments. In response to the comments, we have substantially revised and expanded the Methods section to provide clearer and more comprehensive descriptions. In addition, we have further elaborated on the objectives and scientific basis of the study to improve the overall clarity and rationale of the manuscript.
Warning
Source of clab: r2q0901 is missing!
Warning
Source of clab: r2q1001 is missing!
Warning
Source of clab: r2q1101 is missing!
Warning
Source of clab: r2q1201 is missing!
Warning
Source of clab: r2q1301 is missing!
Warning
Source of clab: r2q0701 is missing!
- Should be more globally distributed. Do not use only asian sources.
Response/Action:
Thank you for your attention and comments. In response to the suggestion, we have added relevant references from non-Asian sources, which help to broaden the international perspective of our work.
- Nice figures!
Response/Action:
Thank you!
References
[1]
Jüttner F, Watson SB, 2007. Biochemical and ecological control of geosmin and 2-methylisoborneol in source waters. Applied and Environmental Microbiology 73, 4395–4406. https://doi.org/10.1128/aem.02250-06
[2]
Clercin NA, Druschel GK, 2019. Influence of environmental factors on the production of MIB and geosmin metabolites by bacteria in a eutrophic reservoir. Water Resources Research 55, 5413–5430. https://doi.org/10.1029/2018wr023651
[3]
Mustapha S, Tijani JO, Ndamitso M, Abdulkareem AS, Shuaib DT, Mohammed AK, 2021. A critical review on geosmin and 2-methylisoborneol in water: Sources , effects, detection, and removal techniques. Environmental Monitoring and Assessment 193. https://doi.org/10.1007/s10661-021-08980-9
[4]
Franklin HM, Podduturi R, Jørgensen NOG, Roberts DT, Schlüter L, Burford MA, 2023. Potential sources and producers of 2-methylisoborneol and geosmin in a river supplying a drinking water treatment plant. Chemical Engineering Journal Advances 14, 100455. https://doi.org/10.1016/j.ceja.2023.100455
[5]
Cerón-Vivas A, Villamizar León MP, Cajigas ÁA, 2022. Geosmin and 2-methylisoborneol removal in drinking water treatment. Water Practice and Technology 18, 159–167. https://doi.org/10.2166/wpt.2022.167