Phosphorus fuels Cladophora growth and self‑reinforcing adhesion via extracellular polysaccharides on hard substrata
Supplementary Information
# These authors contributed equally to this work.
a Key Laboratory of Environmental Aquatic Chemistry, State Key Laboratory of Regional Environment and Sustainability, Research Center for Eco-Environmental Sciences, Chinese Academy of Sciences, Beijing 100085, China.
b China South to North Water Diversion Middle Route Corporation Limited, Beijing 100038, China.
c School of Civil Engineering, Chang’an University, Xi’an 710064, China.
d Institute of Process Engineering, Chinese Academy of Sciences, Beijing 100190, China.
e Hubei Key Laboratory of Intelligent Monitoring, Early Warning and Protection for Watershed Aquatic Ecology, Wuhan 430010, China.
f Water Quality and Aquatic Ecosystem Observation and Research Station of South-to-North Water Diversion Middle Line Project, Beijing 100038, China.
g University of Chinese Academy of Sciences, Beijing 100049, China.
* Corresponding to: Xinzong Xiao (xiaoxinzong@csnwd.com.cn), Ming Su (mingsu@rcees.ac.cn)
Figures and/or tables are provided below as the supplementary evidences to the main text.
Supplementary data
S1.1 Preparation of EPS films
Total EPS obtained as described in Section 2.3 was redissolved at 1 mg mL-1¹. An aliquot of the EPS solution was drop-cast onto freshly cleaved mica disks (12 mm in diameter and 0.1 mm in thickness) and allowed to dry naturally at room temperature to form a continuous film. Independently extracted EPS samples were deposited on separate mica disks and treated as biological replicates. Before force-spectroscopy measurements, the dried EPS films were mounted in the AFM liquid cell and hydrated with PBS (pH 7.4) at approximately 25 °C. This film-based configuration was used throughout; EPS was not immobilized on the probe surface.
S1.2 Probe selection and calibration
RTESPA-150 probes were used for topographic imaging of the dried EPS films, whereas BL-AC40TS Si3N4 probes were used for force-spectroscopy measurements and the chemical-perturbation experiments. The inverse optical lever sensitivity was determined from the linear contact region of force–distance curves acquired on a rigid mica surface under the corresponding measurement conditions. The cantilever spring constant was subsequently determined from the thermal-noise spectrum. The calibrated inverse optical lever sensitivity and spring constant were 82 nm V-1 and 6.0 N m-1, respectively, for RTESPA-150 probes, and 20 nm V-1 and 0.10 N m-1, respectively, for BL-AC40TS probes. The thermal-noise procedure provides an independent calibration of cantilever stiffness from its thermally driven fluctuations.
S1.3 Stepwise disruption of EPS polysaccharide structures
Matched EPS films prepared from the same EPS batch were used to distinguish the contribution of the intact polysaccharide framework from that of glucuronic-acid-containing domains. Native EPS films were first measured as untreated controls.
For polysaccharide-backbone disruption, an aliquot of the extracted total EPS was hydrolyzed with 1 mol L-1 TFA at 121 °C for 2 h. After hydrolysis, TFA was removed by evaporation under a nitrogen stream, and the residue was redissolved in ultrapure water at 1 mg mL-1. The hydrolyzed EPS solution was subsequently drop-cast onto freshly cleaved mica disks and dried under the same conditions as the untreated EPS to prepare matched films for force-spectroscopy measurements.
Following TFA treatment, β-glucuronidase solution was introduced directly into the AFM liquid cell. A 100 μL aliquot of enzyme solution was added to obtain an activity of 1 U mL-1, and force–distance curves were collected after 5, 10, and 20 min of in situ incubation. This additional enzymatic treatment was used to evaluate the involvement of residual glucuronic-acid-containing domains associated with acidic polysaccharides. The native, TFA-treated, and subsequently enzyme-digested states were compared under otherwise identical liquid-phase measurement conditions.
The relative loss of adhesion following TFA hydrolysis was calculated as:
\[R_{\text{TFA}} = \frac{F_{\text{native}} - F_{\text{TFA}}}{F_{\text{native}}} \times 100\%\]
where Fnative and FTFAare the mean adhesion forces of the untreated and TFA-treated EPS films, respectively. The resulting percentage represents the proportion of measured adhesion lost after disruption of the polysaccharide framework and was not interpreted as a directly quantified mass contribution of polysaccharides. The additional decrease following β-glucuronidase digestion was calculated as:
\[\Delta F_{\beta\text{-GUS}} = F_{\text{TFA}} - F_{\text{TFA} + \beta\text{-GUS}}\]
and was used to assess the additional involvement of glucuronic-acid-containing domains in residual EPS-mediated adhesion.
Supplementary Methods S2. EPS-associated extractable phosphorus (EPS-P)
Water-column TP and SRP were measured to characterize the background phosphorus conditions of the Cladophora growth environment. Phosphorus associated with canal-slope sediments was determined to represent the bulk P pool accumulated at the algal–substratum interface. In parallel, an aliquot of the EPS extract was analyzed to quantify phosphorus co-extracted with the extracellular matrix. A procedural blank containing identical extraction reagents but no algal material was processed in parallel, and the blank value was subtracted from the corresponding EPS-extract measurement. A phosphate-free extraction control with comparable pH and ionic strength was additionally included. The corrected fraction is hereafter termed EPS-associated extractable phosphorus (EPS-P).
Supplementary Methods S3. Determination and blank correction of EPS-associated extractable phosphorus
An aliquot of the combined EPS extract was collected before ethanol precipitation for phosphorus determination. A procedural blank containing the same types and volumes of extraction buffers and reagents, but without algal material, was processed through the complete EPS extraction and analytical procedure in parallel with each sample batch. The phosphorus concentration measured in the procedural blank was subtracted from that measured in the corresponding EPS extract: CEPS−P=CEPS extract−Cprocedural blank. A matched phosphate-free extraction system with comparable pH and ionic strength was used to verify that the EPS-P signal was not attributable to phosphate introduced by the extraction medium. EPS-P was expressed as mg kg-1 and operationally defined as the phosphorus pool co-extracted with the extracellular matrix.
Supplementary Methods S4. EPS-mediated adhesion
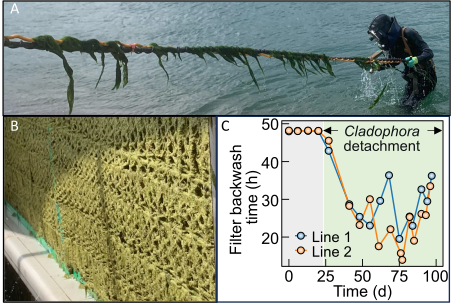
EPS-mediated adhesion should be interpreted as stabilizing attachment-layer establishment and biomass retention during the substrate-associated stage, rather than permanently anchoring individual filaments throughout the vegetation cycle. As the attached biomass matured, hydraulic disturbance and seasonal senescence could promote detachment, after which filamentous material entered the drifting phase and was transported downstream as filament–particle aggregates. Thus, canal-scale persistence reflected sustained or recurrent occupation of favorable wall habitats at the population level, while individual filaments could transition from attached to drifting states.
Supplementary Fig. 1
Supplementary Fig. 2
Supplementary Table 1
| Ingredients | Content | Unit |
|---|---|---|
| Water temperature | 28.16±2.24 | °C |
| pH | 8.35±0.20 | — |
| DO | 8.23±0.56 | mg L-1 |
| CODMn | 1.99±0.21 | mg L-1 |
| COD | 7.43±1.64 | mg L-1 |
| BOD₅ | 0.73±0.39 | mg L-1 |
| NH4+-N | 0.045±0.022 | mg L-1 |
| TP | 6.59±2.67 | μg L-1 |
| TN | 1.06±0.11 | mg L-1 |
| SO42- | 25.29±1.27 | mg L-1 |
Supplementary Fig. 3
Supplementary Fig. 4
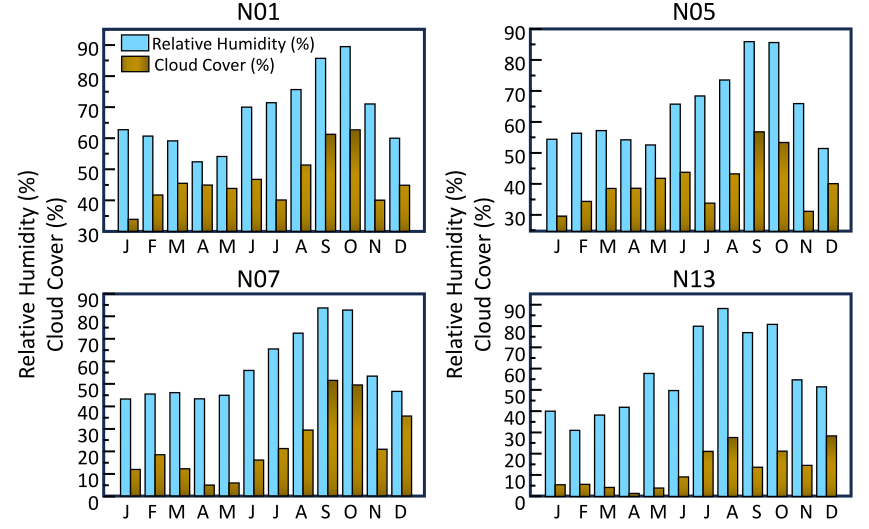
Supplementary Fig. 5
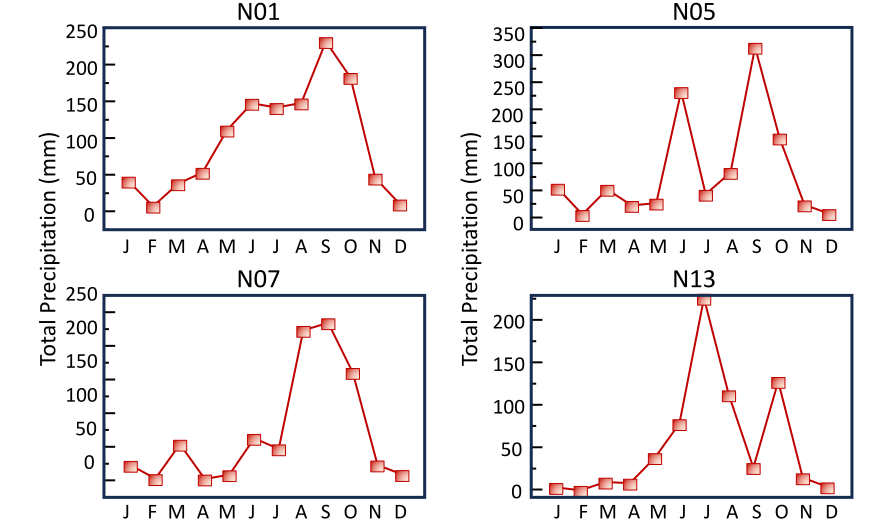
Supplementary Fig. 6
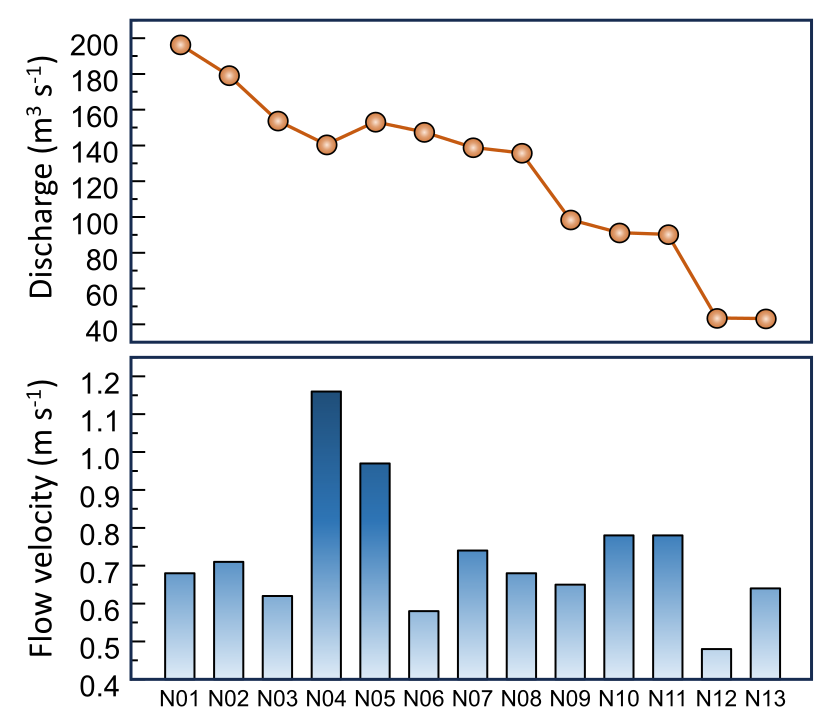
Supplementary Fig. 7
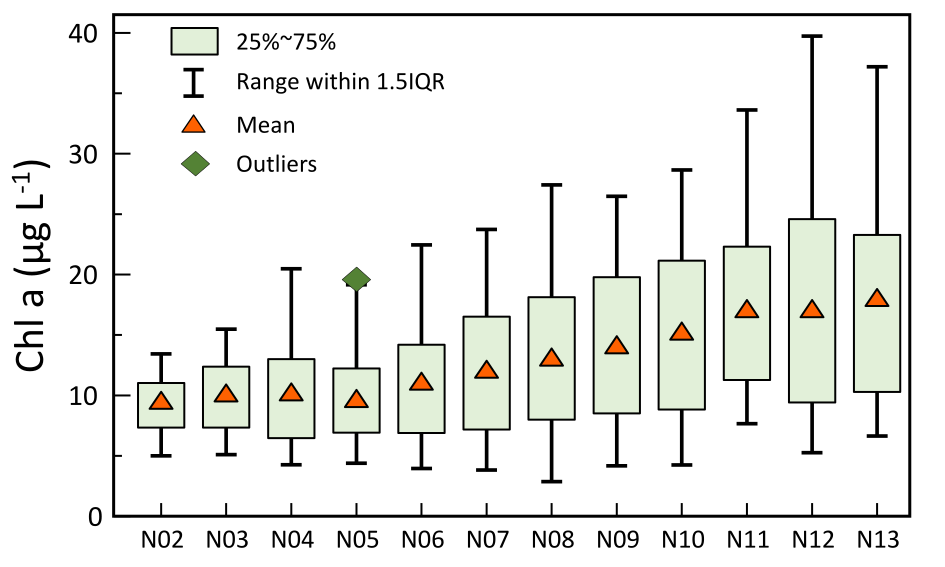
Supplementary Fig. 8
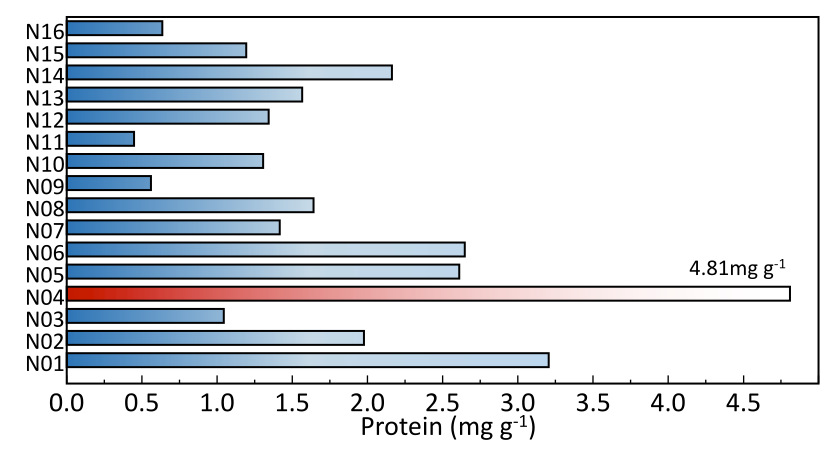
Supplementary Fig. 9
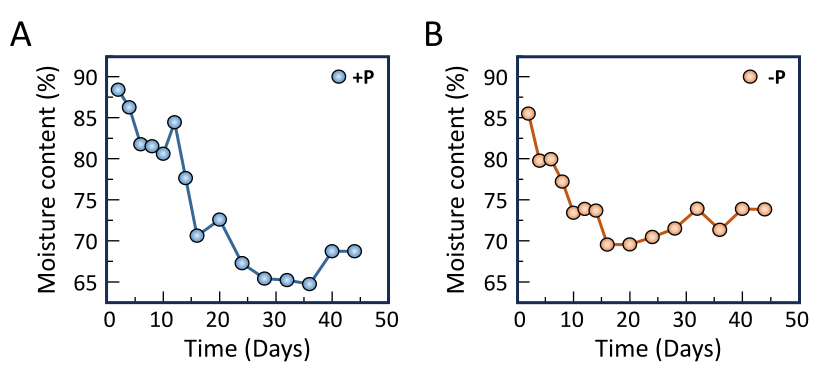
Supplementary Fig. 10
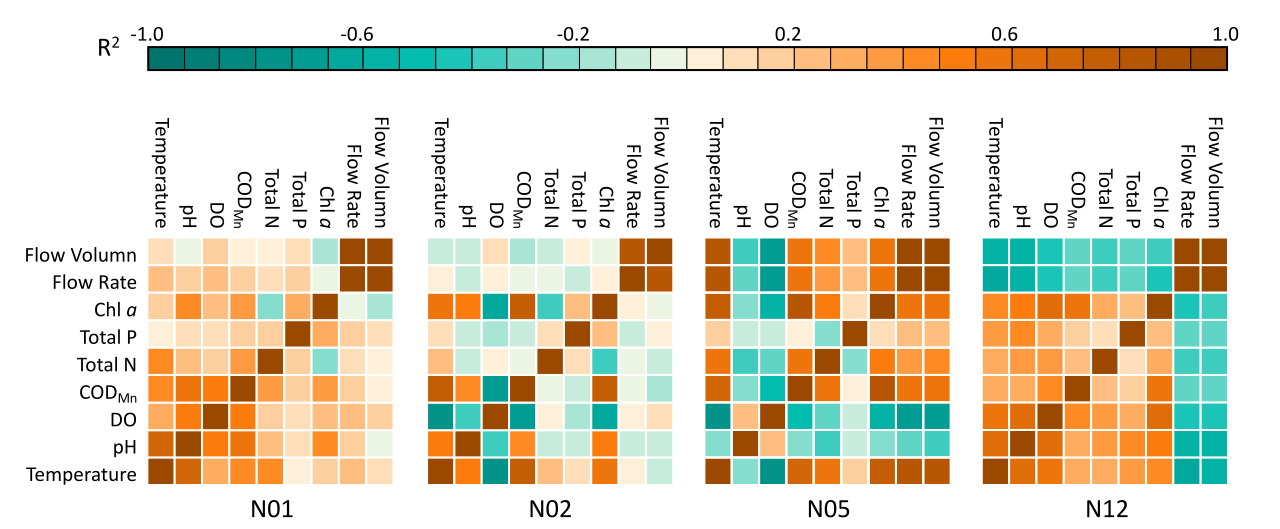
Supplementary Table 2
| Predictor | Estimate | Standard error | t value | P value | Significance |
|---|---|---|---|---|---|
| CODMn | 12.876 | 1.567 | 8.215 | <0.001 | *** |
| Temperature | 1.987 | 0.298 | 6.668 | <0.001 | *** |
| Flow velocity | -8.765 | 8.987 | -0.975 | 0.333 | ns |
| DO | -0.567 | 0.876 | -0.647 | 0.520 | ns |
| TN | -6.234 | 4.123 | -1.512 | 0.136 | ns |
| TP | -23.456 | 56.789 | -0.413 | 0.681 | ns |
| pH | 2.345 | 2.567 | 0.913 | 0.365 | ns |
| Discharge | 0.012 | 0.045 | 0.267 | 0.790 | ns |
Supplementary Fig. 11
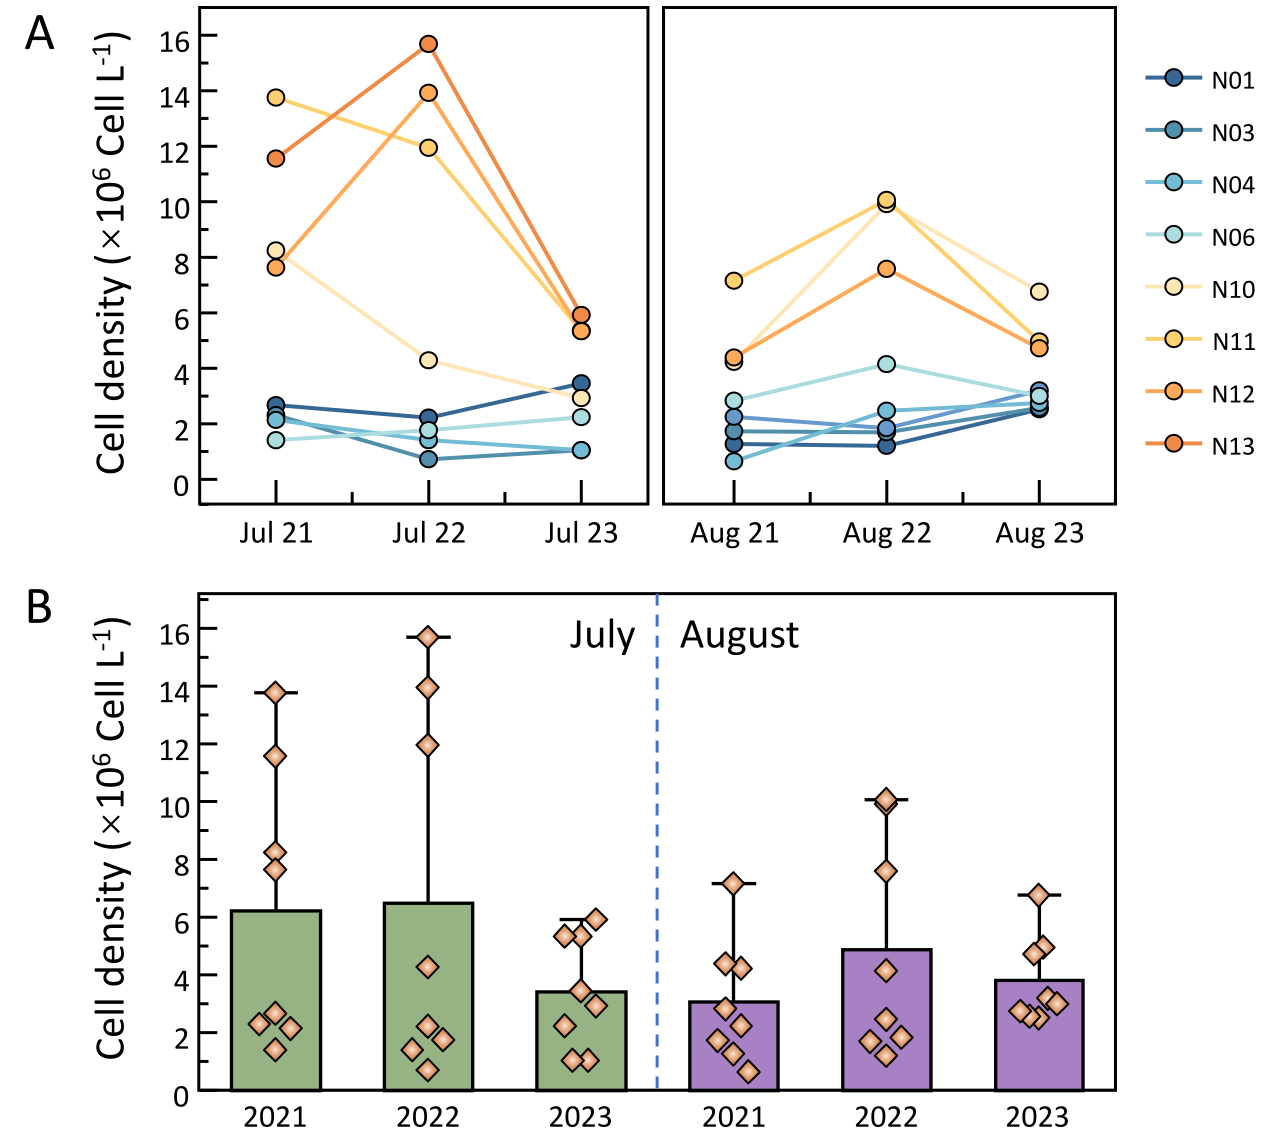
Supplementary Fig. 12
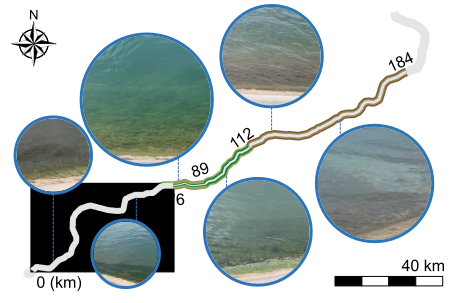
Supplementary Table 3
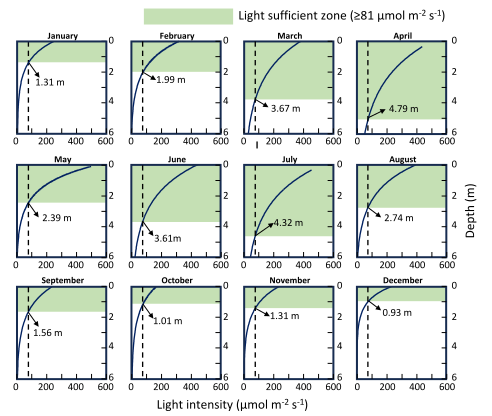
| Month | Transparency (m) | Total radiation (W/m2) | I0 (μmol m-2 s-1) | k (m-1) | Predicted depth (m) |
|---|---|---|---|---|---|
| Jan | 2 | 119.48 | 245.71 | 0.85 | 1.31 |
| Feb | 2.5 | 152.33 | 313.27 | 0.68 | 1.99 |
| Mar | 4 | 187.39 | 385.37 | 0.425 | 3.67 |
| Apr | 4.5 | 240.88 | 495.37 | 0.378 | 4.79 |
| May | 2.2 | 250.23 | 514.59 | 0.773 | 2.39 |
| Jun | 3.6 | 216.63 | 445.49 | 0.472 | 3.61 |
| Jul | 4 | 247.35 | 508.67 | 0.425 | 4.32 |
| Aug | 3 | 185.58 | 381.64 | 0.567 | 2.74 |
| Sep | 2.5 | 113.43 | 233.27 | 0.68 | 1.56 |
| Oct | 2.5 | 78.53 | 161.5 | 0.68 | 1.01 |
| Nov | 2.2 | 108.53 | 223.19 | 0.773 | 1.31 |
| Dec | 1.5 | 113.63 | 233.68 | 1.133 | 0.93 |
Supplementary Fig. 13