
Controlling filamentous cyanobacterial blooms requires adaptive, weather-informed strategy
a Key Laboratory of Environmental Aquatic Chemistry, State Key Laboratory of Regional Environment and Sustainability, Research Center for Eco-Environmental Sciences, Chinese Academy of Sciences, Beijing 100085, China.
b School of Environment and Spatial Informatics, China University of Mining and Technology, Xuzhou 221116, China.
c Management Station of Shuangxikou Reservoir, Reservoir Management Service Center of Yuyao, Ningbo 315423, China.
d College of Environmental Science and Engineering, Ocean University of China, Qingdao 266100, China.
e University of Chinese Academy of Sciences, Beijing 100049, China.
* Corresponding to: Ming Su (mingsu@rcees.ac.cn), Min Yang (yangmin@rcees.ac.cn)
Graphical Abstract
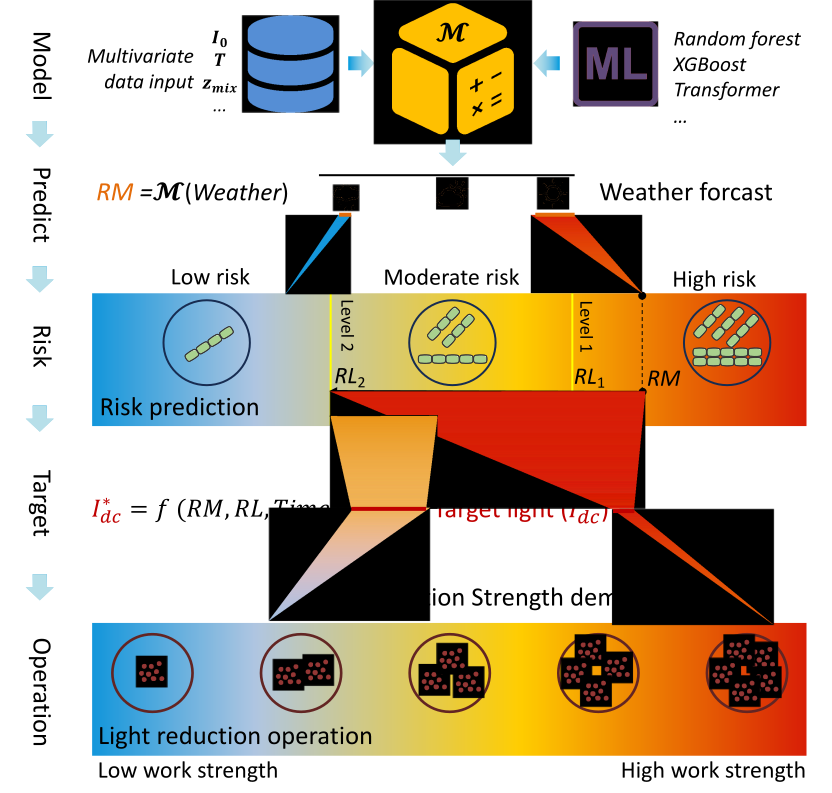
A scalable, adaptive framework that bridges forecasting with intervention, offering a new paradigm for ecological water quality management that supports sustainable drinking water security.
Abstract
The global expansion of filamentous cyanobacteria threatens water security due to their production of toxins and taste-and-odor compounds. As subsurface dwellers, filamentous cyanobacteria are resistant to conventional nutrient and flocculation controls, exposing a management gap. We developed an adaptive, forecast-guided framework that integrates predictive modeling with precision sediment resuspension (SR), in which SR-associated light attenuation likely contributes substantially to bloom suppression. A 2023-2024 survey of 40 reservoirs in eastern China showed filamentous dominance of over 80% biomass in half the systems. An XGBoost model (R2 = 0.57) identified September-October as the highest-risk period, with over 80% of reservoirs affected. SR efficacy is light-dependent: it suppresses growth under low irradiance but can promote it under high light if shading shifts irradiance into the optimal range for filamentous taxa. We optimized SR through modulated sediment flux (0.1-5.2 g L-1) to dynamically attenuate light in response to real-time forecasts. Field validation confirmed forecast-guided SR effectively limited Pseudanabaena via light control. This ecology-based management provides a scalable framework for sustainable water security under changing climates.
Keywords
Filamentous cyanobacteria; Sediment resuspension; Light regulation; Machine learning; Water quality management
Introduction
Global climate change destabilizes freshwater ecosystems and promotes cyanobacterial blooms (Huisman et al., 2018; Paerl and Huisman, 2008). Concurrently, global efforts to reduce nutrient loads are designed to suppress scum-forming genera like Microcystis, but may also alter cyanobacterial succession dynamics and promote increasing dominance or co-occurrence of filamentous cyanobacteria under certain environmental conditions (Komárek and Johansen, 2015; Posch et al., 2012; Su et al., 2019). Such succession patterns may be associated with nitrogen availability and and involve filamentous cyanobacteria with differing nitrogen acquisition strategies, including Pseudanabaena (Acinas et al., 2008) and nitrogen-fixing genera such as Aphanizomenon and Dolichospermum (Beversdorf et al., 2013). This shift complicates management, since many filamentous taxa are important producers of taste-and-odor compounds (e.g., 2-methylisoborneol (2-MIB), geosmin) (Cao et al., 2023; Gaget et al., 2017; Ibelings et al., 2016; Izaguirre and Taylor, 1998; Lu et al., 2022; Mantzouki et al., 2015; Xiao et al., 2024)) and cyanotoxins (Hitzfeld et al., 2000; Lei et al., 2014; Lu et al., 2024; Mohamed et al., 2023; Sinha et al., 2012; Wörmer et al., 2010). And they can impair water quality even at low biomass due to the low odor thresholds of compounds such as 2-MIB (~10 ng L-1) (AWWA, 2010; Watson, 2003)
In contrast to colonial taxa like Microcystis, which thrives across a broader, higher-light range (e.g., 100-500 µmol m-2 s-1 (Hesse et al., 2001; Paerl et al., 1985; Raps et al., 1983; Wiedner et al., 2003)), filamentous cyanobacteria exhibit a unimodal light-response curve with optimal growth at moderate intensities (e.g., 36-85 µmol m-2 s-1 for Pseudanabaena and Planktothricoides) (Cao et al., 2023; Jia et al., 2019; Komárek and Johansen, 2015; Lu et al., 2022; Su et al., 2022; Zohary et al., 2010). Thus they tend to dwell in subsurfaces such as littoral and benthic layers (Gaget et al., 2017; Halstvedt et al., 2007; Su et al., 2019) and access sediment-derived nutrients (Gao et al., 2025; Tatters et al., 2025; Yang et al., 2020), becoming more prevalent as surface-scum blooms weaken due to intensified nutrient reduction efforts. Conventional bloom-control strategies, including nutrient management (Fastner et al., 2015), hydrodynamic adjustments (Lu et al., 2023), and chemical (Anantapantula et al., 2025; Kibuye et al., 2021a; Tsai, 2016; Xu et al., 2024), physical (Bormans et al., 2015; Lee et al., 2014), or biological approaches (Kibuye et al., 2021b), are less effective against these subsurface-dwelling filamentous cyanobacteria (Flores and Herrero, 2009; Tamulonis et al., 2011; Zhi et al., 2023), which often exhibit greater resistance and more treatment-related constraints (Supplementary Table 1). These strategies were designed for the control of surface-scum, buoyant and colonial taxa like Microcystis, exposing a gap in contemporary water quality management approaches.
Given their subsurface-dwelling niche characteristics, regulating the underwater light climate has been recognized as a strategy for controlling filamentous cyanobacteria (Su et al., 2021; Zohary et al., 2010). For example, the suppression of MIB-producing Planktothrix in deep reservoirs has been achieved through water-level manipulation which minimizes shallow areas and reduces underwater light availability (Su et al., 2017, 2015). We developed a sediment resuspension (SR)-based technique that mechanically disperses sediments at the water surface. This method controls cyanobacterial blooms by reducing underwater light availability and promoting particle flocculation, thereby facilitating the removal of algae and phosphorus. This approach can be applied in a wider range of reservoirs than water level manipulation (Fang et al., 2024) and is effective against surface-scum-forming Microcystis due to their predominantly linear light-response pattern under common weather conditions. However, the method is less effective against filamentous cyanobacteria due to their linear trichome morphology, weaker aggregation capacity, and lower optimal light requirements under subsurface environments (Flores and Herrero, 2009; Jia et al., 2019; Lu et al., 2022; Tamulonis et al., 2011; Wang et al., 2011; Xu et al., 2019; Zhi et al., 2023). Reducing underwater light intensity through SR or other measures may favor these subsurface‑dwelling filamentous taxa, especially under high solar radiation conditions that would otherwise inhibit their growth. Based on these ecological characteristics, we hypothesize that filamentous cyanobacteria occupy a distinct ecological niche, with heightened sensitivity to underwater light availability and optimal growth under moderate light intensities. Consequently, effective bloom management in filamentous‑dominated water bodies must account for real‑time weather conditions; failure to do so may lead to suboptimal or even counterproductive outcomes. We further hypothesize that integrating real‑time weather forecasting with adaptive control strategies provides a robust framework for managing such blooms—a prediction we test here using SR as an experimental tool.
We present an adaptive framework integrating weather forecasting, predictive modeling, and precision sediment resuspension to mitigate harmful filamentous cyanobacterial blooms. The approach, developed from a one-year survey of 40 reservoirs in eastern China, employs a machine-learning model to assess bloom risk and uses field-based light manipulation experiments targeting Pseudanabaena, a dominant filamentous cyanobacterial genus frequently associated with bloom events (Xiao et al., 2024) during investigation, to define critical light thresholds. The resulting adaptive strategies dynamically combine real-time meteorological data with species-specific niche characteristics for targeted bloom control. This framework provides a practical solution for managing blooms that cause taste-and-odor issues and cyanotoxin production, advancing sustainable water quality management.
Materials and methods
Sample collection in 40 reservoirs and preparation
Water samples (1 L) from the surface layer (0.5 m) were collected using a Kemmerer water sampler from 40 drinking water reservoirs in Zhejiang Province, China, covering 4 cities with a latitude spanning from 28°00’ N to 31°50’ N (Fig. 1). The reservoirs primarily consisted of important water source systems across eastern China, covering a range of nutrient environments (Supplementary Fig. 2). Physicochemical parameters (pH, redox potential (ORP), depth, turbidity, water temperature, and chlorophyll-a) were recorded using a multi-water quality parameter instrument (YSI 6600V2, US) during each sampling session. The mixed layer depth (\(z_{\text{mix}}\)) was identified as the depth at which the temperature deviated by 0.2-0.5 °C from the surface temperature (Kara et al., 2000; Read et al., 2011). For phytoplankton analysis, 500 mL subsamples were preserved with 5% Lugol’s iodine (v/v), settled for 48 h, and preconcentrated 20× prior to microscopic enumeration (Sherr and Sherr, 1993). Phytoplankton identification followed refs (Bellinger and Sigee, 2015; Komarek et al., 2014; Komárek and Anagnostidis, 1998), using an upright microscope (Olympus BX53, Japan) following the protocol established by ref. (Martinez et al., 1975). The filamentous cyanobacteria abundance was calculated based on the length of each filament and the mean cell length of each strain. The number of cells in colony species such as Microcystis sp. was estimated based on colony volume and mean cell number per volume. The mean cell morphological characteristics including cell length, cell volume etc. were determined according to >50 filaments/colonies of each strain using a in-house developed cell counting tool (CCT v1.4, https://drwater.net, in Chinese) (Fang et al., 2024; Lu et al., 2022).
In-situ suppression of Pseudanabaena under varying light attenuation levels
Field experiments targeting Pseudanabaena suppression were conducted in S Reservoir (29°93’N, 121°33’E, Fig. 3a) during a bloom event from May to June 2024, with initial Pseudanabaena abundance reaching (9.81 ± 0.43) × 108 cells L-1. Five custom cylindrical simulators (height: 2.0 m, diameter: 0.5 m), designated L1-L5, were fixed on a floating platform. Each simulator was filled with raw bloom water from the reservoir, maintaining surface level alignment with the reservoir. A 0.2 µm filter membrane at the base prevented introduction of external algae while permitting natural nutrients exchange. Variable irradiance conditions were created using light-blocking films with five transmittance areas: 0.004 m2 (L1), 0.026 m2 (L2), 0.068 m2 (L3), 0.102 m2 (L4) and 0.196 m2 (L5). HOBO Pendant 64K loggers (UA-002-64) positioned at different depths (0.05 m, 0.5 m, 1.0 m, 2.0 m) recorded water temperature and light intensity at 15-minute intervals. The initial median light intensity (0.05 m, 9:00 and 16:00) in each simulator on Day 1 of SR deployment was 5.9 µmol m2 s-1 (L1), 89.0 µmol m2 s-1 (L2), 248.3 µmol m2 s-1 (L3), 571.1 µmol m2 s-1 (L4) and 670.4 µmol m2 s-1 (L5), respectively (Supplementary Fig. 3). Since the experiment was conducted in-situ, light availability in the setup was weather-dependent. Daily water samples (300 mL) were collected from three depths (0.5 m, 1.0 m and 2.0 m) between 08:00 and 09:00 h. Subsamples (200 mL) were preserved with 5% Lugol’s iodine for cell enumeration, left to settle for 48 hours, and pre-concentrated 10× before being stored in the dark for later counting. Parallel subsamples (100 mL) were filtered through 0.45 µm PES membrane for nutrient concentrations analysis (total nitrogen, total phosphorus, total ammonia nitrogen) using a Continuous Flow Analyzer (SAN ++, Skalar Analytical B.V).
In-situ assessment of underwater light attenuation under varying sediment loads
Five cuboid simulators (4.0 m × 0.5 m × 0.5 m) were deployed on a floating platform with open hydraulic exchange (Fig. 4a). Native sediment samples collected by Ekman dredge were partitioned into five portions with different weights: 0.3 kg, 6.3 kg, 12.4 kg, 18.5 kg and 25.0 kg. Due to a moisture content of approximately 67%, the dry weights (sediment particles) in each portion were approximately 0.1 kg, 2.0 kg, 4.0 kg, 6.0 kg, and 8.0 kg, respectively. These were homogenized (30 min orbital mixing) and slowly injected into simulators (7:00-8:00) to achieve initial sediment concentration of 0.1-8.0 g L-1. Five HOBO Pendant 64K loggers (UA-002-64) recording temperature and light intensity were positioned at different depths (0.5 m, 1.0 m, 2.0 m, 3.0 m and 4.0 m) with 15-min resolution.
The field application of sediment resuspension in S Reservoir
Severe Pseudanabaena and Raphidiopsis blooms were found in S Reservoir, an anonymized drinking-water reservoir in eastern China (29°55’50.2’‘N, 121°19’53.03’’E) in June 2023. Short-term SR operations (two devices, day 1-5, 10 h per day) were conducted around risk area (29°55’38.39”N, 121°20’2.86”E, 12 ha). Surface sediment was dredged by shipborne SR equipment and sprayed to water surface (Fang et al., 2024). Each position sediment was re-suspended approximately 5 times per day (\(n\) = 5). The water depth of the area was around 28.0 m. After 5 days, only one device remained operating in the reservoir due to decreased light intensity and reduced bloom density (Supplementary Fig. 12). The sediment concentration (\(c_{sed}\)) and control responses in this operation were analysed according to our previous study (Fang et al., 2024).
Water samples (1 L) from the surface layer (0.5m) were collected every 2 days using a Kemmer water sampler from each site. The cell counting and preparation method was described in section 2.1. Fifteen temperature and light data loggers (HOBO Pendant 64K, UA-002-64) were positioned within the water column at different depths (uniformly distributed throughout the entire depth). Water temperature and underwater light intensities were recorded every 15 minutes.
Data analysis
Data calculation
The extinction coefficient (\(k\), m-1) was determined according to a logarithmic-linear model between underwater light intensity (\(I\), µmol m-2 s-1) and water depth (\(z\), m) at different depths, following the Beer-Lambert Law (Cao et al., 2023) (Eq. 1).
\[I_z = I_0e^{-kz} \tag{1}\]
where \(I_0\) represents light intensity at the surface and \(I_z\) represents light intensity at depth \(z\).
Planktonic cells can move vertically in the water column, resulting in non-homogeneous light availability over time. We use a simplified model that assumes cells are evenly distributed in surface mixed layer (\(z_{mix}\), m). The instantaneous light available to an algal cell (\(I_c\), µmol m-2 s-1) was calculated by Eq. 2.
\[I_c = I_0\frac{1-e^{-kz_{mix}}}{kz_{mix}} \tag{2}\]
According to Eq. 2, the daily underwater light available (\(I_{dc}\), mol m-2 d-1) was calculated by Eq. 3.
\[I_{dc} = \sum(\overline{I_{c_{(i)}}+I_{c_{(i+15)}}} \times 900) \tag{3}\]
where \(I_{c_{(i)}}\) represents \(I_c\) analysed every 15 minutes.
Regarding the control experiment, the cell control rate (\(CR\)) was calculated based on the cell density decrease (\(N_{t2}/N_{t1}\)) over time (\(t_2-t_1\), d), which was determined by the slope of log10-linear model between \(N_t\) and \(t\):
\[CR = \frac{log_{10}(N_{t2})-log_{10}(N_{t1})}{t_2-t_1} \tag{4}\]
The impact of SR on the extinction coefficient dynamics was analysed. The extinction coefficient (\(k\), m-1) followed a logarithmic decay model with time (\(t\), min) within each treatment (Eq. 5):
\[\phi = \phi_0 - \rho\log_{10}(t) \tag{5}\]
Here, \(\phi = k / k_{\text{0}}\) is the relative extinction coefficient, with \(\phi_0\) representing its initial value at \(t\) = 1 min after SR and \(k_{\text{0}}\) representing the background extinction coefficient due to water properties and pre‐existing bloom self‐shading. The parameter \(\rho\) quantifies the rate of decline in \(\phi\) over time. Both \(\phi_0\) and \(\rho\) were subsequently described using second‐order polynomial models (Eq. 6, Eq. 7):
\[ \phi_0 = \alpha + \beta c_{\text{sed}} + \gamma c_{\text{sed}}^2 \tag{6}\]
\[ \rho = \delta + \varepsilon c_{\text{sed}} + \zeta c_{\text{sed}}^2 \tag{7}\]
Based on these equations (Eq. 6, Eq. 7), the extinction coefficient (\(k\), Eq. 8) is expressed as a function of time (\(t\)) relative to SR, the concentration of resuspended sediment (\(c_{\text{sed}}\)), and the background extinction coefficient (\(k_{\text{0}}\)):
\[ k = k_{\text{0}}(\phi_0 - \rho\log_{10}(t)) \tag{8}\]
Workflow for determining optimal sediment resuspension (SR) operating conditions
SR intensity is defined by suspended-sediment concentration (\(c_{\text{sed}}\)) and resuspension frequency (\(n\), cycles d-1), with lower frequency considered more cost-effective (Supplementary Fig. 13). First, we calculated the critical control rate (\(CR^*\)) based on the modeled risk (\(RM\), expressed as filamentous cyanobacteria cell density) and our target risk level (\(RL\), expressed as filamentous cyanobacteria cell density) to be achieved within \(N\) days (Eq. 9).
\[CR^* = (\log_{10}(RM) - \log_{10}(RL))/N \tag{9}\]
Second, the required underwater-light reduction (expressed as critical light dose \(I_{\text{dc}}^*\)) was determined from \(CR^*\) via an \(I_{\text{dc}}\)-\(CR\) model derived from in-situ experiments (Fig. 3e). Third, minimum SR intensities (Fig. 5a; Supplementary Fig. 13) were calculated using an SR-underwater-light model based on the nonlinear relationship between sediment concentration (\(c_{\text{sed}}\)) and light conditions, quantified by the light-extinction coefficient (\(k\)) and light dose (\(I_{\text{dc}}\)) (Fig. 4d, Supplementary Fig. 26-Supplementary Fig. 65). SR operation may not be required under certain weather conditions and current risk levels; such cases are labelled “Not Necessary”. Additionally, SR may be deemed “Not Applicable” when the required frequency exceeds practical or cost-effective limits-here, more than five cycles per day was considered infeasible.
Statistical analysis and model evaluation
All analyses and visualizations were conducted in R 4.0 using the vegan and tidyverse packages (Dixon, 2003; R Core Team, 2021; Wickham et al., 2019). Box plots show medians, interquartile ranges (IQR), and 1.5 × IQR whiskers, with outliers indicated as points; other variables are presented as mean ± standard error. Statistical significance was defined at p < 0.05. Bloom risk was predicted using an XGBoost regression model (500 trees, trained with a 5/6-1/6 train-test split). Model robustness was assessed using 10-fold cross-validation, and performance evaluated by \(R^2\), RMSE, MAE, and bias calculated on log10-transformed cyanobacterial abundance. Sensitivity analysis was further conducted by analysing optimal SR conditions across a broad range of predicted bloom intensities and meteorological conditions (Fig. 5c). To account for biological response lags, light exposure was represented by cumulative or averaged cellular light dose over a defined time window (e.g., the days preceding a forecast target), rather than instantaneous irradiance.
Results
Widespread filamentous cyanobacterial dominance in eastern Chinese drinking water reservoirs
Our investigation of 40 reservoirs in eastern China (28°00’-31°50’N; Fig. 1a) revealed that over 45% (18 reservoirs) exhibited total cyanobacterial densities exceeding 5 × 10⁷ cells L-1 (Supplementary Fig. 1) during summer and autumn-surpassing the moderate bloom threshold defined by China’s National Environmental Protection Standard (HJ 1098-2020) and aligning with WHO guideline ranges (Ingrid and Jamie, 1999; Pilotto et al., 1997). Only one reservoir (ZGZ) maintained densities below 1 × 10⁶ cells L-1 (Supplementary Fig. 1). Filamentous cyanobacteria (e.g., Pseudanabaena, Raphidiopsis, Lyngbya) dominated (>50% relative cell abundance) in 72.5% of reservoirs (29/40), with 52.5% (21/40) exceeding 80% relative cell abundance. In contrast, Microcystis prevailed in 22.5% (9/40) of reservoirs (Fig. 1d). Mean densities reached 0.84 × 10⁸ cells L-1 for filamentous and 0.28 × 10⁸ cells L-1 for colonial cyanobacteria (Fig. 1c), with maxima of 4.70 × 10⁸ cells L-1 (filamentous) and 3.58 × 10⁸ cells L-1 (colonial) (Fig. 1c). Over 10 filamentous genera were identified (Fig. 1b&e), led by Pseudanabaena (25.34%), Raphidiopsis (21.56%), and Lyngbya (15.22%) (Fig. 1f). Pseudanabaena exceeded 1 × 10⁸ cells L-1-a level comparable to WHO alert thresholds (Ingrid and Jamie, 1999)-in three reservoirs, where it comprised >90% of total cyanobacterial abundance. This genus was detected in 30 reservoirs, 13 of which surpassed 2 × 10⁷ cells L-1 (Fig. 1e).

XGBoost-based forecasting of filamentous cyanobacterial bloom risks
An XGBoost-based model was developed to assess the risk of filamentous cyanobacterial blooms in 40 drinking water reservoirs across various months. The model incorporated key variables, including mixing layer depth (\(z_{\text{mix}}\), Supplementary Fig. 5), cellular light available (\(I_\text{dc}\), Supplementary Fig. 6), water temperature (\(\text{T}\), Supplementary Fig. 7), surface irradiance, sampling month, and reservoir latitude. Model performance was evaluated using a held-out test set. It demonstrated predictive performance within the range of 106 to 109 cells L-1, achieving an \(R^2\) of 0.5704 for the testing dataset (\(p\) < 0.0001). The model yielded an RMSE of 0.24, an MAE of 0.17, and a bias of 0.02 in log10-transformed abundance (Fig. 2a). Using this model, the bloom risk was evaluated for the months between March and October (Fig. 2b) while the remaining months were excluded from the model’s scope due to lower temperatures and minimal bloom risks.
The lowest risk of 0.34 × 10⁸ cells L-1 occurred in March (Supplementary Fig. 8a), coinciding with the lowest water temperature (14.34 ºC; Supplementary Fig. 8c) and light intensity (0.74 mol m-2 d-1; Supplementary Fig. 8b). August exhibited a relatively low risk (0.25 × 10⁸ cells L-1), despite having the highest water temperature (30.92 ºC) and light intensity (2.15 mol m-2 d-1). Higher bloom risks were observed in months with moderate water temperature and light intensity, including October (0.78 × 10⁸ cells L-1), September (0.77 × 10⁸ cells L-1), May (0.25 × 10⁸ cells L-1), and June (0.42 × 10⁸ cells L-1).
Bloom risk for filamentous cyanobacteria was evaluated according to the WHO guidelines and applied for control targets by SR: Risk Level 1 (\(RL_1\)) at 1 × 10⁸ cells L-1 and Risk Level 2 (\(RL_2\)) at 2 × 10⁷ cells L-1 (Supplementary Fig. 9) (Ingrid and Jamie, 1999). The proportion of reservoirs exceeding \(RL_1\) was 40% (16 reservoirs) in October and 15% (6 reservoirs) in September. For \(RL_2\), exceedance occurred from March to October, peaking in October (90%) and September (82.5%). Notably, 62.5% of reservoirs still exceeded \(RL_2\) even in March, a month of typically low bloom risk.

Underwater light thresholds for the suppression of filamentous cyanobacteria based on in-situ experiment
Culture studies indicate that filamentous cyanobacteria have lower optimal light requirements than surface-scum-forming Microcystis (Cao et al., 2023; Jia et al., 2019; Lu et al., 2022; Su et al., 2022; Wang et al., 2011). Given its widespread occurrence across the surveyed reservoirs, Pseudanabaena was selected as a model taxon to evaluate light-regulation strategies (Fig. 1b, c). We conducted a light-gradient experiment in S Reservoir under five natural irradiance levels (\(I_{\text{c}}\), L1-L5: 6.3 µmol m-2 s-1 - 603.3 µmol m-2 s-1; Fig. 3b, c). Light intensities of 466.3 µmol m-2 s-1 or lower (L1-L4) suppressed Pseudanabaena (\(p < 0.01\)), reducing abundance by 0.06 d-1 - 0.13 d-1 (Fig. 3d). By day 12, cell densities in L1-L4 fell to (0.10 ± 0.00) × 108 cells L-1 - (1.27 ± 0.00) × 108 cells L-1, while L5 (603.4 µmol m-2 s-1) maintained 47.5% survival ((4.66 ± 0.00) × 108 cells L-1) despite identical initial densities ((9.81 ± 0.43) × 108 cells L-1; Fig. 3d). A linear model (\(CR = -0.14I_{\text{dc}} + 0.44\), \(R^2 = 0.985\), \(p = 0.0007\); Fig. 3e) confirmed that reducing underwater light intensity (\(I_{\text{dc}}\)) limits Pseudanabaena proliferation, with each decrease of 1 mol m-2 d-1 in light intensity increasing the control rate (\(CR\)) by 0.14 d-1.

Dynamic modeling of light attenuation through sediment resuspension
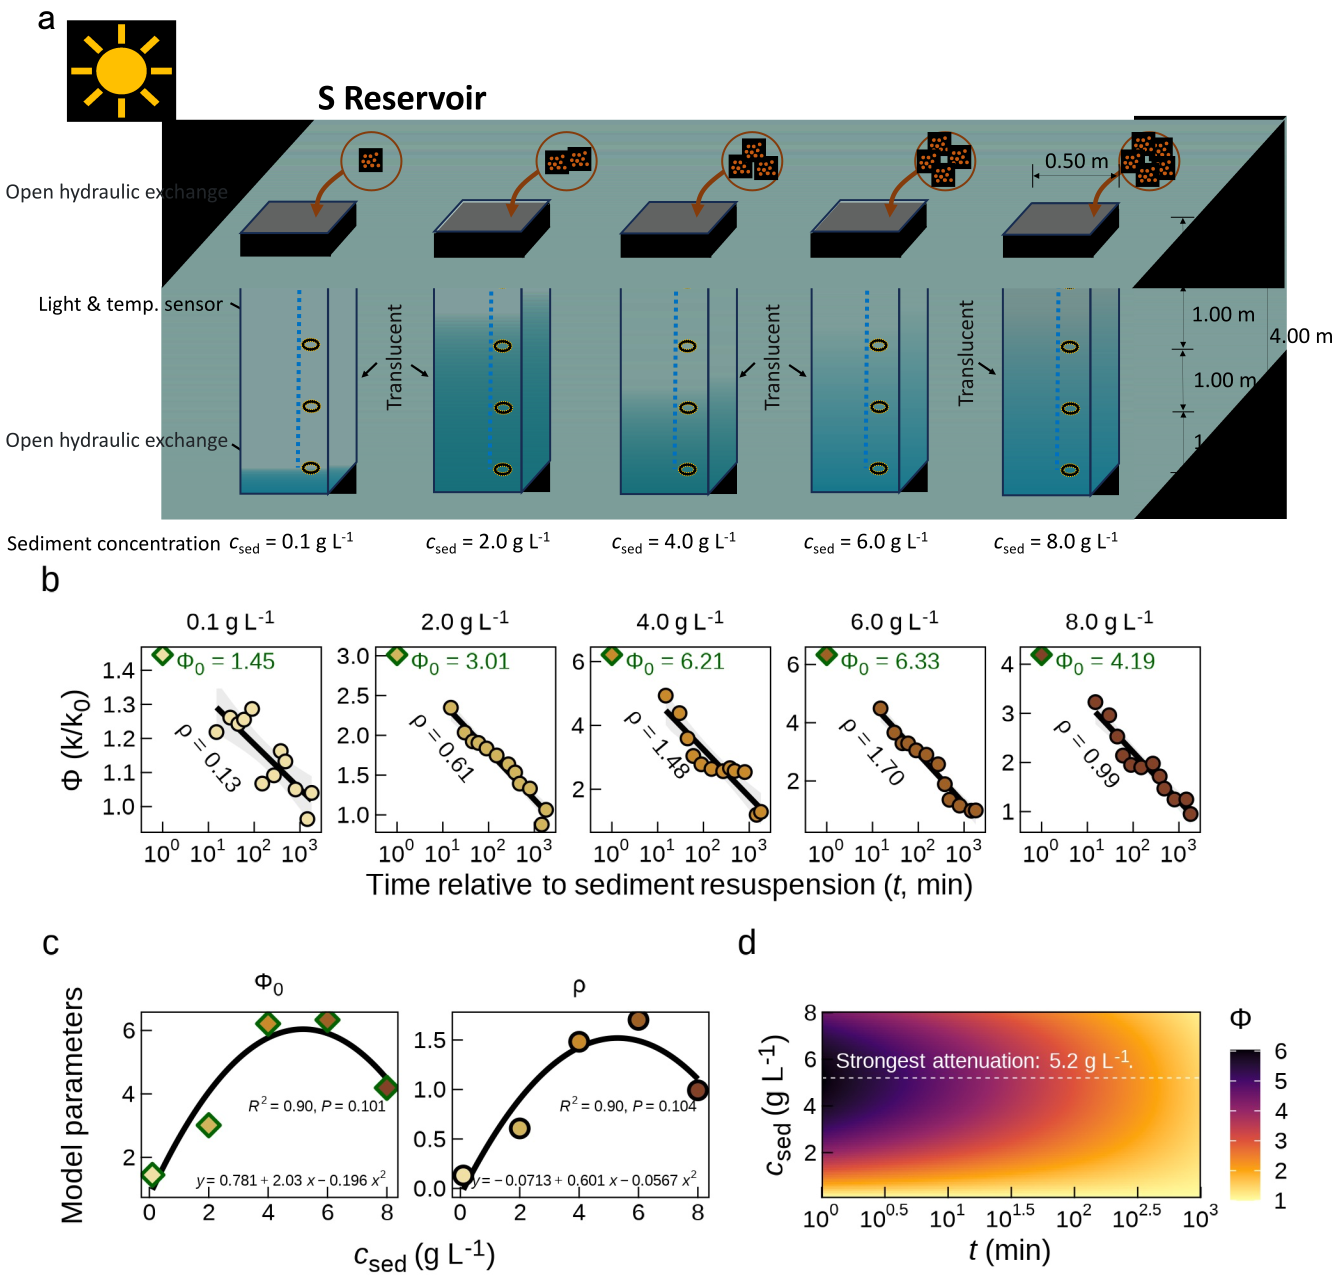
We evaluated light attenuation through SR in a field experiment in S Reservoir, applying five sediment concentrations (\(c_{\text{sed}}\): 0.1, 2.0, 4.0, 6.0, and 8.0 g L-1; Fig. 4a, b). The \(\phi_0\) and \(\rho\) were described using second-order polynomial models (Fig. 4c) as shown below:
\[\phi_0 = 0.781 + 2.03c_{\text{sed}} -0.196c_{\text{sed}}^2 \tag{10}\] \[\rho = -0.0713 + 0.601c_{\text{sed}} - 0.0567c_{\text{sed}}^2 \tag{11}\] \[k = (\phi_0 - \rho\log_{10}(t))k_0 \tag{12}\]
Based on these equations (Eq. 10, Eq. 11), the extinction coefficient (\(k\), Eq. 12) is expressed. To illustrate the model’s behavior, we simulated sediment concentrations ranging from 0.1 g L-1 to 8 g L-1 and time intervals from 1 minute to 1000 minutes (Fig. 4d). The model revealed a nonlinear response of \(k\) to \(c_{\text{sed}}\), with \(k\) plateauing at an intermediate sediment concentration of 5.2 g L-1 (95% CI: 4.1-6.2 g L-1) under the tested sediment properties.
Weather forecast-based operational sediment resuspension to control filamentous cyanobacteria
To suppress filamentous cyanobacteria to a target risk level under variable weather, we developed a decision cascade integrating predictive modeling with SR-based light regulation (Supplementary Fig. 13).
We applied the framework (Supplementary Fig. 13) to the 40 reservoirs based on their modeled monthly risk levels from March through October, determining the SR intensity (\(I_{\text{SR}}\)) required to suppress filamentous cyanobacteria to \(RL_2\) (2 × 10⁷ cells L-1) within \(N = 10\) days (Fig. 5a). In March, 32.5% (13/40) of reservoirs, and in August, 42.5% (17/40), required no intervention because cyanobacterial densities remained below the target threshold (Fig. 4), aligning with lower bloom risks during these months. Moderate SR intensities (0.1-0.5 g L-1) were sufficient for 20-60% of reservoirs across the study period, peaking at 60% in March, April, and September (Fig. 5a, Supplementary Fig. 11), highlighting broad applicability under typical conditions. Three reservoirs-LY (June), LHT (July), and XK (October)-required elevated SR intensities (3.0-4.0 g L-1). The most demanding scenarios (4.0-5.2 g L-1) targeted reservoirs with extreme risks, including CT (July, 1.95 × 10⁸ cells L-1), HM (March, April, June, August; 1.94 × 10⁸ cells L-1 - 3.00 × 10⁸ cells L-1), and SXK (June, 2.41 × 10⁸ cells L-1). SR efficacy was limited in reservoirs such as HM (May, July, September, October), SXK (May), and GXZ/YML (October), where achieving the target suppression required operational durations exceeding 10 days-a constraint attributed to light-limited sediment-retention efficiency.
The field validation of the framework’s predictive accuracy (predicted: 2.41 × 10⁸ cells L-1, observed: 2.23 × 10⁸ cells L-1; Fig. 2) and necessary weather‑adaptive SR operations was conducted in a single reservoir (S Reservoir) during one bloom event, without replicated treatments or a control (Fig. 5b). This was due to operational constraints imposed by the reservoir authority, which prioritizes drinking water safety and maintains fixed SR schedules. Nevertheless, the field-implemented SR (\(c_{\text{sed}} = 1.5\) g L-1, \(n = 5\) cycles d-1) achieved a control efficiency of 0.10 d-1 and reduced biomass to 0.89 × 10⁸ cells L-1 within 5 days. This was followed by further decline associated with weather conditions, which is consistent with the mechanistic predictions from our mesocosm (Fig. 3) and literature‑based analyses (Supplementary Fig. 25). Future work should include replicated, multi‑site validations to strengthen the statistical generalizability of the framework.
For broader scenarios, we evaluated SR applicability across varying initial algal densities (0.8-2.8 × 10⁸ cells L-1, Supplementary Fig. 18-Supplementary Fig. 23), mixing depths (6-28 m, Supplementary Fig. 16), and daily irradiance (\(I_{\text{0}}\): 0-20 mol m-2 d-1) (Fig. 5c), which also provides a sensitivity assessment of how uncertainty in bloom intensity influences SR recommendations. At a mixing depth of 6.0 m and relatively low initial densities, SR consistently reduced abundance below \(RL_2\) (2 × 10⁷ cells L-1) within 10 days across all \(I_{\text{0}}\) conditions. Under low-light regimes (\(I_0\) below 10.5 mol m-2 d-1, 7.9 mol m-2 d-1 and 6.1 mol m-2 d-1 for densities of 0.8 × 10⁸ cells L-1, 1.2 × 10⁸ cells L-1 and 1.6 × 10⁸ cells L-1), cyanobacteria declined naturally without intervention. In contrast, at higher initial densities, suppression failed when \(I_{\text{0}}\) exceeded critical thresholds (16.6 mol m-2 d-1, 12.5 mol m-2 d-1 and 9 mol m-2 d-1 for 2.0 × 10⁸ cells L-1, 2.4 × 10⁸ cells L-1 and 2.8 × 10⁸ cells L-1), even with 10-day SR. Higher \(I_{\text{0}}\) generally required greater SR intensity (\(c_{\text{sed}} \times n\))-for example, at 2.8 × 10⁸ cells L-1, 8.6 ≤ I0 ≤ 8.9 mol m-2 d-1 demanded 4.0 - 4.8 g L-1 (n = 5), whereas 0.1 - 4.7 g L-1 (n = 1) sufficed at \(I_{\text{0}}\) = 6.0 mol m-2 d-1. These thresholds scale with typical seasonal irradiance, which ranges from 2.4 - 10.9 mol m-2 d-1 (winter) to 10.6 - 18.3 mol m-2 d-1 (summer).

Discussion
The succession of phytoplankton communities under global climate change scenarios has been extensively discussed, though the direction of this succession remains inconclusive (Benedetti et al., 2021; Dai et al., 2023; Henson et al., 2021; Winder and Sommer, 2012). While many studies suggest that global warming favors the proliferation of warm-adapted, buoyant cyanobacteria such as Microcystis (Carey et al., 2012), the situation in China appears to differ. Our survey of 40 reservoirs, along with observations from major lakes such as Lake Taihu and Lake Chaohu, indicates that submerged filamentous cyanobacteria have become the dominant cyanobacterial group in many Chinese water bodies in recent years (Ai et al., 2025; Huo et al., 2021; Su et al., 2022; Zhang et al., 2020).
The mechanisms driving this shift remain incompletely understood, but we suggest that China’s intensive, nationwide nutrient-reduction efforts may be a key contributing factor. Nutrient reduction may favor the proliferation of filamentous cyanobacteria (Su et al., 2019) by creating ecological conditions that select for taxa with enhanced tolerance to low-light environments, access to sediment-derived nutrients, and, in some genera, nitrogen-fixing capability (Halstvedt et al., 2007; Komárek and Johansen, 2015), while simultaneously reducing the competitive advantage of surface-scum-forming Microcystis. The decline of dense surface blooms may also increase light penetration into deeper water layers and littoral sediments, potentially facilitating the growth of subsurface and benthic filamentous cyanobacterial populations (Catherine et al., 2013; Scott and Marcarelli, 2012). Such benthic populations may further act as persistent source pools of cyanobacterial biomass, contributing to subsequent bloom development. In addition to light adaptation, differences in nitrogen acquisition strategies may also contribute to cyanobacterial succession. Unlike Microcystis (Kim et al., 2020), some filamentous genera such as Aphanizomenon and Dolichospermum can fix atmospheric nitrogen (Feuring et al., 2026; Fiore et al., 2005; Z. Liu et al., 2024; Scoglio et al., 2024) and may therefore gain a competitive advantage under nitrogen-limited conditions (Y. Liu et al., 2024). Although nitrogen limitation was not evident in our field surveys (Supplementary Fig. 2) or experiments (Supplementary Fig. 4), variation in nitrogen-fixing capacity among filamentous cyanobacteria may partially influence community succession. Future studies could further evaluate the potential of nif-related indicators for adaptive bloom management (Cao et al., 2023; Dixon and Kahn, 2004; Pi et al., 2025; Tromas et al., 2017).
While water temperature is a key driver of growth (Karlberg and Wulff, 2012; Maurer et al., 2024; Thomas and Litchman, 2015), it is difficult to manipulate in the field. The submerged niche makes light regulation a practical control strategy-either by increasing the light-transmission distance (water-level manipulation) or adjusting the light-extinction coefficient (turbidity regulation) according to the Lambert-Beer law (Su et al., 2021, 2017). Understanding their light response is essential for effective implementation. This narrower, irradiance-defined growth window suggests that filamentous cyanobacterial dynamics are sensitive to short-term light variability (Supplementary Fig. 17).
Sediment resuspension (SR) has emerged as a light-regulation-based strategy for cyanobacterial control. It is suitable for drinking-water reservoirs as it avoids chemical use and is economically feasible compared to alternatives such as salvage and sediment dredging (Yu et al., 2017). Although SR effectively suppresses Microcystis blooms through flocculation and settling (Fang et al., 2024), its efficacy against filamentous cyanobacteria is complicated by their low light requirements and greater resistance to flocculation (Lucas Pardo et al., 2015; Song et al., 2023; Zhi et al., 2023). Our findings reveal that SR-associated light attenuation may be an important factor influencing control efficacy and this effect is dynamically modulated by ambient weather conditions. Under high solar radiation, SR-induced shading risks alleviating photo-inhibition, thereby promoting growth (Supplementary Fig. 17, Supplementary Fig. 24). In contrast, under reduced ambient light (e.g., overcast or post-rain conditions), SR-associated shading may drive underwater light below survival thresholds. These findings suggest that SR implementation could benefit from a forecast-driven adaptive framework, targeting intervention windows when ambient light conditions are more likely to facilitate bloom suppression.
By integrating weather forecasting, our strategy dynamically adjusts SR flux to optimize underwater light climate and maximize control of filamentous cyanobacteria. We present a scalable, adaptive framework that bridges forecasting with intervention, offering a paradigm for ecological water quality management that supports sustainable drinking water security (Fig. 6). This approach offers operational advantages: it aligns control with forecasted environmental windows (as demonstrated in S Reservoir, where further SR was halted after five days in response to weather changes), increases ecological precision by tailoring light attenuation to species-specific light-response traits, and enables proactive, data-driven management that adapts to both short-term weather variability and long-term climate trends-shifting cyanobacterial control from reactive mitigation to forecast-guided prevention.
SR promotes sediment oxidation, enhancing aerobic processes and suppressing the release of reduced solutes, thereby immobilizing phosphorus, iron, and manganese in the sediment (Broman et al., 2017; Chen et al., 2021; Fang et al., 2024; Fu et al., 2024). However, this process also entails risks, most notably a transient manganese pulse when background soluble Mn exceeds ~100 μg L‐1 (Su et al., 2025). Potential impacts on aquatic biota—including fish and microbial communities—appear limited under moderate SR regimes, with field observations indicating no detectable ecological disruption. Although fish responses were not directly assessed, moderate SR‐induced nutrient exchange may indirectly support higher trophic levels and contribute to top‐down control of algal biomass (Havens, 1991; Yahel et al., 2008).
Our study provides a practical pathway for implementing this adaptive framework while highlighting areas for future refinement. The XGBoost model demonstrated moderate predictive performance (R2 = 0.57), consistent with regional environmental models operating under limited spatiotemporal resolution (Abbas et al., 2023; Pawley et al., 2024; Read et al., 2014). Its fidelity is constrained by monthly sampling frequency, cross-reservoir heterogeneity, and the absence of short-term drivers like sub-daily light variability (Wahlin and Grimvall, 2008). Importantly, sensitivity analyses Fig. 5c across a broad range of bloom intensities and meteorological conditions demonstrated that uncertainty in predicted bloom intensity influences the magnitude of recommended SR interventions, while the overall light-regulation framework remains robust. Higher operational accuracy will require reservoir-specific models trained on high-frequency, long-term datasets, (e.g., 2–3 years per reservoir) together with periodic retraining to accommodate changing environmental conditions and future climate scenarios.
Although light thresholds were derived from Pseudanabaena, whose filamentous and photophysiological traits are representative of many nuisance taxa, extending threshold determination to a broader range of cyanobacterial genera would enhance ecological generality and predictive robustness. For instance, taxa such as Aphanizomenon may become dominant under cooler conditions, taxa such as Dolichospermum may may maintain competitive advantages under nitrogen-limited environments, whereas other genera may prevail under different seasonal light and temperature regimes (Feuring et al., 2026; Z. Liu et al., 2024; Maurer et al., 2024; Paerl and Otten, 2015). In addition, the optimal irradiance for cyanotoxin production may differ from that for cyanobacterial growth, potentially leading to asynchronous responses between bloom suppression and toxin or taste-and-odor control under light-regulation strategies (Cao et al., 2023). Consequently, future adaptive management frameworks should incorporate taxa-specific ecological characteristics, integrate cyanotoxin monitoring, and explore the potential value of nif-related indicators for anticipating shifts toward nitrogen-fixing filamentous cyanobacteria (Cao et al., 2023; Dixon and Kahn, 2004; Pi et al., 2025), while light-regulation thresholds may require calibration according to the dominant cyanobacterial community in different reservoirs and seasons.
In operational deployments, SR protocols should be calibrated using site-specific optical and sediment properties. Background light attenuation (\(k_0\)) should be constrained through in-situ measurements, while sediment composition and settling dynamics must inform the optimization of SR intensity and frequency (Hipsey et al., 2019; Kirk, 2010). The framework is scalable and transferable beyond drinking-water reservoirs. It enables risk-informed, spatially targeted interventions in larger or more heterogeneous systems, minimizing basin-wide disturbance while improving operational efficiency and economic sustainability.
Conclusions
This study demonstrates that filamentous cyanobacteria have become the dominant phytoplankton group in drinking water reservoirs in eastern China. The XGBoost-based predictive model identified September-October as the highest-risk period for filamentous cyanobacterial blooms. Field experiments established critical light thresholds for Pseudanabaena suppression and light attenuation model by SR under ambient weather conditions. Accordingly, we developed an adaptive, weather-informed framework that integrates machine learning forecasting with precision sediment resuspension for bloom control. This adaptive approach providing a scalable solution for sustainable water quality management under changing climates.
Declaration of competing interest
The authors declare that they have no known competing financial interests or personal relationships that could have appeared to influence the work reported in this paper.
Acknowledgement
This work was financially supported by the National Natural Science Foundation of China (Grant No. W2412156 and 51878649), Shaoxing Yuanshui Group Co., Ltd. (Grant No. TPSK2025008), the China South to North Water Diversion Middle Route Corporation Limited (Grant No. NSBDZX/SH/KY‑2025‑002). and the National Key R&D Program of China (2022YFC3203603).
Data availability
Data is available at https://git.drwater.net/codes/fang2026controlling.git.
References
Abbas, A., Park, M., Baek, S.-S., Cho, K.H., 2023. Deep learning-based algorithms for long-term prediction of chlorophyll-a in catchment streams. Journal of Hydrology 626, 130240. https://doi.org/10.1016/j.jhydrol.2023.130240
Acinas, S.G., Haverkamp, T.H.A., Huisman, J., Stal, L.J., 2008. Phenotypic and genetic diversification of Pseudanabaena spp. (cyanobacteria). The ISME Journal 3, 31–46. https://doi.org/10.1038/ismej.2008.78
Ai, Y., Wu, Y., Su, M., Gui, Y., Du, Y., Fang, J., Cao, T., Yang, M., 2025. Cyanobacterial crowding-out effects on metabolite partitioning: Modeling 2-methylisoborneol (MIB) release dynamics and implications. Journal of Hazardous Materials 140118. https://doi.org/10.1016/j.jhazmat.2025.140118
Anantapantula, S., Wittenzeller, S., Gladfelter, M.F., Tenison, S.E., Zinnert, H., Belfiore, A.P., Wilson, A.E., 2025. Copper sulfate treatment harms zooplankton and ultimately promotes algal blooms: A field mesocosm experiment. Harmful Algae 142, 102800. https://doi.org/10.1016/j.hal.2025.102800
AWWA, A.W.W.A., 2010. Algae: Source to treatment. American Water Works Association.
Bellinger, E., Sigee, D., 2015. Freshwater algae: Identification, enumeration and use as bioindicators: Second edition. https://doi.org/10.1002/9781118917152
Benedetti, F., Vogt, M., Elizondo, U.H., Righetti, D., Zimmermann, N.E., Gruber, N., 2021. Major restructuring of marine plankton assemblages under global warming. Nature Communications 12. https://doi.org/10.1038/s41467-021-25385-x
Beversdorf, L.J., Miller, T.R., McMahon, K.D., 2013. The role of nitrogen fixation in cyanobacterial bloom toxicity in a temperate, eutrophic lake. PLoS ONE 8, e56103. https://doi.org/10.1371/journal.pone.0056103
Bormans, M., Maršálek, B., Jančula, D., 2015. Controlling internal phosphorus loading in lakes by physical methods to reduce cyanobacterial blooms: A review. Aquatic Ecology 50, 407–422. https://doi.org/10.1007/s10452-015-9564-x
Broman, E., Sjöstedt, J., Pinhassi, J., Dopson, M., 2017. Shifts in coastal sediment oxygenation cause pronounced changes in microbial community composition and associated metabolism. Microbiome 5. https://doi.org/10.1186/s40168-017-0311-5
Cao, T., Fang, J., Jia, Z., Zhu, Y., Su, M., Zhang, Q., Song, Y., Yu, J., Yang, M., 2023. Early warning of MIB episode based on gene abundance and expression in drinking water reservoirs. Water Research 231, 119667. https://doi.org/https://doi.org/10.1016/j.watres.2023.119667
Carey, C.C., Ibelings, B.W., Hoffmann, E.P., Hamilton, D.P., Brookes, J.D., 2012. Eco-physiological adaptations that favour freshwater cyanobacteria in a changing climate. Water Research 46, 1394–1407. https://doi.org/10.1016/j.watres.2011.12.016
Catherine, Q., Susanna, W., Isidora, E.-S., Mark, H., Aurélie, V., Jean-François, H., 2013. A review of current knowledge on toxic benthic freshwater cyanobacteria – ecology, toxin production and risk management. Water Research 47, 5464–5479. https://doi.org/10.1016/j.watres.2013.06.042
Chen, H., Wang, Z., Liu, H., Nie, Y., Zhu, Y., Jia, Q., Ding, G., Ye, J., 2021. Variable sediment methane production in response to different source-associated sewer sediment types and hydrological patterns: Role of the sediment microbiome. Water Research 190, 116670. https://doi.org/10.1016/j.watres.2020.116670
Dai, Y., Yang, S., Zhao, D., Hu, C., Xu, W., Anderson, D.M., Li, Y., Song, X.-P., Boyce, D.G., Gibson, L., Zheng, C., Feng, L., 2023. Coastal phytoplankton blooms expand and intensify in the 21st century. Nature 615, 280–284. https://doi.org/10.1038/s41586-023-05760-y
Dixon, P., 2003. VEGAN, a package of r functions for community ecology. Journal of Vegetation Science 14, 927–930. https://doi.org/10.1111/j.1654-1103.2003.tb02228.x
Dixon, R., Kahn, D., 2004. Genetic regulation of biological nitrogen fixation. Nature Reviews Microbiology 2, 621–631. https://doi.org/10.1038/nrmicro954
Fang, J., Li, Y., Su, M., Cao, T., Sun, X., Ai, Y., Qin, J., Yu, J., Yang, M., 2024. Mitigating harmful cyanobacterial blooms in drinking water reservoirs through in-situ sediment resuspension. Water Research 267, 122509. https://doi.org/10.1016/j.watres.2024.122509
Fastner, J., Abella, S., Litt, A., Morabito, G., Vörös, L., Pálffy, K., Straile, D., Kümmerlin, R., Matthews, D., Phillips, M.G., Chorus, I., 2015. Combating cyanobacterial proliferation by avoiding or treating inflows with high p load experiences from eight case studies. Aquatic Ecology 50, 367–383. https://doi.org/10.1007/s10452-015-9558-8
Feuring, A., Lawrence, C.D., Salcedo, J., Whitehouse, M.J., Vogts, A., Zoccarato, L., Klawonn, I., 2026. Fungal parasites infecting N2-fixing cyanobacteria reshape carbon and N2 fixation and trophic transfer. Nature Communications 17. https://doi.org/10.1038/s41467-025-67818-x
Fiore, M. de F., Neilan, B.A., Copp, J.N., Rodrigues, J.L.M., Tsai, S.M., Lee, H., Trevors, J.T., 2005. Characterization of nitrogen-fixing cyanobacteria in the brazilian amazon floodplain. Water Research 39, 5017–5026. https://doi.org/10.1016/j.watres.2005.10.002
Flores, E., Herrero, A., 2009. Compartmentalized function through cell differentiation in filamentous cyanobacteria. Nature Reviews Microbiology 8, 39–50. https://doi.org/10.1038/nrmicro2242
Fu, L., Liu, Y., Wang, M., Lian, C., Cao, L., Wang, W., Sun, Y., Wang, N., Li, C., 2024. The diversification and potential function of microbiome in sediment-water interface of methane seeps in south china sea. Frontiers in Microbiology 15. https://doi.org/10.3389/fmicb.2024.1287147
Gaget, V., Humpage, A.R., Huang, Q., Monis, P., Brookes, J.D., 2017. Benthic cyanobacteria: A source of cylindrospermopsin and microcystin in Australian drinking water reservoirs. Water Research 124, 454–464. https://doi.org/10.1016/j.watres.2017.07.073
Gao, G., Bai, D., Li, T., Li, J., Jia, Y., Li, J., Wang, Z., Cao, X., Song, L., 2025. Understanding filamentous cyanobacteria and their adaptive niches in lake honghu, a shallow eutrophic lake. Journal of Environmental Sciences 152, 219–234. https://doi.org/10.1016/j.jes.2024.05.010
Halstvedt, C.B., Rohrlack, T., Andersen, T., Skulberg, O., Edvardsen, B., 2007. Seasonal dynamics and depth distribution of Planktothrix spp. In Lake Steinsfjorden (Norway) related to environmental factors. Journal of Plankton Research 29, 471–482. https://doi.org/10.1093/plankt/fbm036
Havens, K.E., 1991. Fish-induced sediment resuspension: Effects on phytoplankton biomass and community structure in a shallow hypereutrophic lake. Journal of Plankton Research 13, 1163–1176. https://doi.org/10.1093/plankt/13.6.1163
Henson, S.A., Cael, B.B., Allen, S.R., Dutkiewicz, S., 2021. Future phytoplankton diversity in a changing climate. Nature Communications 12. https://doi.org/10.1038/s41467-021-25699-w
Hesse, K., Dittmann, E., BÃrner, T., 2001. Consequences of impaired microcystin production for light-dependent growth and pigmentation of Microcystis aeruginosa PCC 7806. FEMS Microbiology Ecology 37, 39–43. https://doi.org/10.1111/j.1574-6941.2001.tb00851.x
Hipsey, M.R., Bruce, L.C., Boon, C., Busch, B., Carey, C.C., Hamilton, D.P., Hanson, P.C., Read, J.S., Sousa, E. de, Weber, M., Winslow, L.A., 2019. A general lake model (GLM 3.0) for linking with high-frequency sensor data from the global lake ecological observatory network (GLEON). Geoscientific Model Development 12, 473–523. https://doi.org/10.5194/gmd-12-473-2019
Hitzfeld, B.C., Höger, S.J., Dietrich, D.R., 2000. Cyanobacterial toxins: Removal during drinking water treatment, and human risk assessment. Environmental Health Perspectives 108, 113–122. https://doi.org/10.1289/ehp.00108s1113
Huisman, J., Codd, G.A., Paerl, H.W., Ibelings, B.W., Verspagen, J.M.H., Visser, P.M., 2018. Cyanobacterial blooms. Nature Reviews Microbiology 16, 471–483. https://doi.org/10.1038/s41579-018-0040-1
Huo, D., Gan, N., Geng, R., Cao, Q., Song, L., Yu, G., Li, R., 2021. Cyanobacterial blooms in china: Diversity, distribution, and cyanotoxins. Harmful Algae 109, 102106. https://doi.org/10.1016/j.hal.2021.102106
Ibelings, B.W., Fastner, J., Bormans, M., Visser, P.M., 2016. Cyanobacterial blooms. Ecology, prevention, mitigation and control: Editorial to a CYANOCOST special issue. Aquatic Ecology 50, 327–331. https://doi.org/10.1007/s10452-016-9595-y
Ingrid, C., Jamie, B., 1999. Toxic cyanobacteria in water: A guide to their public health consequences, monitoring, and management. E & FN Spon, London New York.
Izaguirre, G., Taylor, W.D., 1998. A Pseudanabaena species from Castaic Lake, California, that produces 2-methylisoborneol. Water Research 32, 1673–1677. https://doi.org/10.1016/s0043-1354(97)00379-5
Jia, Z., Su, M., Liu, T., Guo, Q., Wang, Q., Burch, M., Yu, J., Yang, M., 2019. Light as a possible regulator of MIB-producing Planktothrix in source water reservoir, mechanism and in-situ verification. Harmful Algae 88, 101658. https://doi.org/10.1016/j.hal.2019.101658
Kara, A.B., Rochford, P.A., Hurlburt, H.E., 2000. An optimal definition for ocean mixed layer depth. Journal of Geophysical Research: Oceans 105, 16803–16821. https://doi.org/10.1029/2000jc900072
Karlberg, M., Wulff, A., 2012. Impact of temperature and species interaction on filamentous cyanobacteria may be more important than salinity and increased pCO2 levels. Marine Biology 160, 2063–2072. https://doi.org/10.1007/s00227-012-2078-3
Kibuye, F.A., Zamyadi, A., Wert, E.C., 2021a. A critical review on operation and performance of source water control strategies for cyanobacterial blooms: Part i-chemical control methods. Harmful Algae 109, 102099. https://doi.org/10.1016/j.hal.2021.102099
Kibuye, F.A., Zamyadi, A., Wert, E.C., 2021b. A critical review on operation and performance of source water control strategies for cyanobacterial blooms: Part II-mechanical and biological control methods. Harmful Algae 109, 102119. https://doi.org/10.1016/j.hal.2021.102119
Kim, K., Mun, H., Shin, H., Park, S., Yu, C., Lee, J., Yoon, Y., Chung, H., Yun, H., Lee, K., Jeong, G., Oh, J., Lee, I., Lee, H., Kang, T., Ryu, H.S., Park, J., Shin, Y., Rhew, D., 2020. Nitrogen stimulates Microcystis-dominated blooms more than phosphorus in river conditions that favor non-nitrogen-fixing genera. Environmental Science & Technology 54, 7185–7193. https://doi.org/10.1021/acs.est.9b07528
Kirk, J.T.O., 2010. Light and photosynthesis in aquatic ecosystems. Cambridge University Press. https://doi.org/10.1017/cbo9781139168212
Komarek, J., Kastovsky, J., Mares, J., Johansen, J.R., 2014. Taxonomic classification of cyanoprokaryotes (cyanobacterial genera) 2014, using a polyphasic approach. Preslia 86, 295–335.
Komárek, J., Anagnostidis, K., 1998. Cyanoprokaryota 1, Susswasserflora Von Mitteleuropa. Deu.
Komárek, J., Johansen, J.R., 2015. Chapter 4 - filamentous cyanobacteria, in: Freshwater Algae of North America (Second Edition). Academic Press, Boston, pp. 135–235. https://doi.org/10.1016/b978-0-12-385876-4.00004-9
Lee, K., Chantrasakdakul, P., Kim, D., Kong, M., Park, K.Y., 2014. Ultrasound pretreatment of filamentous algal biomass for enhanced biogas production. Waste Management 34, 1035–1040. https://doi.org/10.1016/j.wasman.2013.10.012
Lei, L., Peng, L., Huang, X., Han, B.-P., 2014. Occurrence and dominance of Cylindrospermopsis raciborskii and dissolved cylindrospermopsin in urban reservoirs used for drinking water supply, south china. Environmental Monitoring and Assessment 186, 3079–3090. https://doi.org/10.1007/s10661-013-3602-8
Liu, Y., Zhu, G., Fan, Y., Guo, C., 2024. Successional conditions of Dolichospermum and Microcystis in taihu lake, china. Journal of Oceanology and Limnology 42, 1777–1788. https://doi.org/10.1007/s00343-024-4063-3
Liu, Z., Xie, F., Wang, L., Yu, L., Shi, X., Yang, Z., Zhang, M., 2024. Response of heterocyst differentiation of Dolichospermum to different forms of nitrogen deficiency. Harmful Algae 139, 102742. https://doi.org/10.1016/j.hal.2024.102742
Lu, J., Su, M., Su, Y., Fang, J., Burch, M., Cao, T., Wu, B., Yu, J., Yang, M., 2023. MIB-derived odor management based upon hydraulic regulation in small drinking water reservoirs: Principle and application. Water Research 244, 120485. https://doi.org/10.1016/j.watres.2023.120485
Lu, J., Su, M., Su, Y., Wu, B., Cao, T., Fang, J., Yu, J., Zhang, H., Yang, M., 2022. Driving forces for the growth of MIB-producing Planktothricoides raciborskii in a low-latitude reservoir. Water Research 118670. https://doi.org/10.1016/j.watres.2022.118670
Lu, Z., Cai, Q., Lai, S., Chen, N., Huang, L., Liu, Y., Lei, L., Gan, S., Zhang, L., Paerl, H.W., Wang, F., 2024. Coupling of cylindrospermopsin and pho-harboring verrucomicrobia supports the formation of Raphidiopsis blooms in low-phosphorus waters. Water Research 250, 121010. https://doi.org/10.1016/j.watres.2023.121010
Lucas Pardo, M.A. de, Sarpe, D., Winterwerp, J.C., 2015. Effect of algae on flocculation of suspended bed sediments in a large shallow lake. Consequences for ecology and sediment transport processes. Ocean Dynamics 65, 889–903. https://doi.org/10.1007/s10236-015-0841-y
Mantzouki, E., Visser, P.M., Bormans, M., Ibelings, B.W., 2015. Understanding the key ecological traits of cyanobacteria as a basis for their management and control in changing lakes. Aquatic Ecology 50, 333–350. https://doi.org/10.1007/s10452-015-9526-3
Martinez, M., Chakroff, R., Pantastico, J., 1975. Note: Direct phytoplankton counting techniques, using the haemacytometer. Philippine agriculturist.
Maurer, J.A., Xia, R., Kim, A.M., Oblie, N., Hefferan, S., Xie, H., Slitt, A., Jenkins, B.D., Bertin, M.J., 2024. Temporal dynamics of cyanobacterial bloom community composition and toxin production from urban lakes. ACS ES&T Water 4, 3423–3432. https://doi.org/10.1021/acsestwater.4c00266
Mohamed, Z.A., Elnour, R.O., Alamri, S., Hashem, M., 2023. Paramecium jenningsi effectively grazes on toxic Raphidiopsis raciborskii and degrades cylindrospermopsin: Implications for control harmful cyanobacterial blooms. Ecohydrology & Hydrobiology 23, 614–622. https://doi.org/10.1016/j.ecohyd.2023.04.004
Paerl, H.W., Bland, P.T., Bowles, N.D., Haibach, M.E., 1985. Adaptation to high-intensity, low-wavelength light among surface blooms of the cyanobacterium Microcystis aeruginosa. Applied and Environmental Microbiology 49, 1046–1052. https://doi.org/10.1128/aem.49.5.1046-1052.1985
Paerl, H.W., Huisman, J., 2008. Blooms like it hot. Science 320, 57–58. https://doi.org/10.1126/science.1155398
Paerl, H.W., Otten, T.G., 2015. Duelling “CyanoHABs”: Unravelling the environmental drivers controlling dominance and succession among diazotrophic and non‐N2 ‐fixing harmful cyanobacteria. Environmental Microbiology 18, 316–324. https://doi.org/10.1111/1462-2920.13035
Pawley, S.M., Atkinson, L., Utting, D.J., Hartman, G.M.D., Atkinson, N., 2024. Evaluating spatially enabled machine learning approaches to depth to bedrock mapping, alberta, canada. PLOS ONE 19, e0296881. https://doi.org/10.1371/journal.pone.0296881
Pi, H.-W., Yu, C.-P., Chen, Y.-F., Wu, B.-S., Peng, L.-Y., Li, W.-H., 2025. Nitrogen-fixing microbes gain genes in diverse types of living environments. Proceedings of the National Academy of Sciences 122. https://doi.org/10.1073/pnas.2523106122
Pilotto, L.S., Douglas, R.M., Burch, M.D., Cameron, S., Beers, M., Rouch, G.J., Robinson, P., Kirk, M., Cowie, C.T., Hardiman, S., Moore, C., Attewell, R.G., 1997. Health effects of exposure to cyanobacteria (blue-green algae) during recreational water-related activities. Australian and New Zealand Journal of Public Health 21, 562–566. https://doi.org/10.1111/j.1467-842x.1997.tb01755.x
Posch, T., Köster, O., Salcher, M.M., Pernthaler, J., 2012. Harmful filamentous cyanobacteria favoured by reduced water turnover with lake warming. Nature Climate Change 2, 809. https://doi.org/10.1038/nclimate1581
R Core Team, 2021. R: A language and environment for statistical computing. R Foundation for Statistical Computing, Vienna, Austria.
Raps, S., Wyman, K., Siegelman, H.W., Falkowski, P.G., 1983. Adaptation of the cyanobacterium Microcystis aeruginosa to light intensity. Plant Physiology 72, 829–832. https://doi.org/10/fnbmfx
Read, J.S., Hamilton, D.P., Jones, I.D., Muraoka, K., Winslow, L.A., Kroiss, R., Wu, C.H., Gaiser, E., 2011. Derivation of lake mixing and stratification indices from high-resolution lake buoy data. Environmental Modelling & Software 26, 1325–1336. https://doi.org/10.1016/j.envsoft.2011.05.006
Read, J.S., Winslow, L.A., Hansen, G.J.A., Van Den Hoek, J., Hanson, P.C., Bruce, L.C., Markfort, C.D., 2014. Simulating 2368 temperate lakes reveals weak coherence in stratification phenology. Ecological Modelling 291, 142–150. https://doi.org/10.1016/j.ecolmodel.2014.07.029
Scoglio, G.D., Jackson, H.O., Purton, S., 2024. The commercial potential of Aphanizomenon flos-aquae, a nitrogen-fixing edible cyanobacterium. Journal of Applied Phycology 36, 1593–1617. https://doi.org/10.1007/s10811-024-03214-0
Scott, J.T., Marcarelli, A.M., 2012. Cyanobacteria in freshwater benthic environments, in: Ecology of Cyanobacteria Ii. Springer Netherlands, pp. 271–289. https://doi.org/10.1007/978-94-007-3855-3_9
Sherr, E.B., Sherr, B.F., 1993. Preservation and storage of samples for enumeration of heterotrophic protists. Handbook of Methods in Aquatic Microbial Ecology. Lewis Publishers, Boca Raton 207–212.
Sinha, R., Pearson, L.A., Davis, T.W., Burford, M.A., Orr, P.T., Neilan, B.A., 2012. Increased incidence of Cylindrospermopsis raciborskii in temperate zones – is climate change responsible? Water Research 46, 1408–1419. https://doi.org/10.1016/j.watres.2011.12.019
Song, Y., Zhang, B., Si, M., Chen, Z., Geng, J., Liang, F., Xi, M., Liu, X., Wang, R., 2023. Roles of extracellular polymeric substances on Microcystis aeruginosa exposed to different sizes of polystyrene microplastics. Chemosphere 312, 137225. https://doi.org/10.1016/j.chemosphere.2022.137225
Su, M., Andersen, T., Burch, M., Jia, Z., An, W., Yu, J., Yang, M., 2019. Succession and interaction of surface and subsurface cyanobacterial blooms in oligotrophic/mesotrophic reservoirs: A case study in Miyun Reservoir. Science of the Total Environment 649, 1553–1562. https://doi.org/J.scitotenv.2018.08.307
Su, M., Jia, D., Yu, J., Vogt, R.D., Wang, J., An, W., Yang, M., 2017. Reducing production of taste and odor by deep-living cyanobacteria in drinking water reservoirs by regulation of water level. Science of the Total Environment 574, 1477–1483. https://doi.org/10.1016/j.scitotenv.2016.08.134
Su, M., Li, W., Fang, J., Cao, T., Ai, Y., Lü, C., Zhao, J., Yang, Z., Yang, M., 2025. Effects of oxygenation resuspension on DOM composition and its role in reducing dissolved manganese in drinking water reservoirs. Environmental Science & Technology. https://doi.org/10.1021/acs.est.5c00235
Su, M., Suruzzaman, MD., Zhu, Y., Lu, J., Yu, J., Zhang, Y., Yang, M., 2021. Ecological niche and in-situ control of MIB producers in source water. Journal of Environmental Sciences 110, 119–128. https://doi.org/10.1016/j.jes.2021.03.026
Su, M., Yu, J., Zhang, J., Chen, H., An, W., Vogt, R.D., Andersen, T., Jia, D., Wang, J., Yang, M., 2015. MIB-producing cyanobacteria (Planktothrix sp.) in a drinking water reservoir: Distribution and odor producing potential. Water Research 68, 444–453. https://doi.org/10.1016/j.watres.2014.09.038
Su, M., Zhu, Y., Andersen, T., Wang, X., Yu, Z., Lu, J., Song, Y., Cao, T., Yu, J., Zhang, Y., Yang, M., 2022. Light-dominated selection shaping filamentous cyanobacterial assemblages drives odor problem in a drinking water reservoir. npj Clean Water 5, 37. https://doi.org/10.1038/s41545-022-00181-2
Tamulonis, C., Postma, M., Kaandorp, J., 2011. Modeling filamentous cyanobacteria reveals the advantages of long and fast trichomes for optimizing light exposure. PLoS ONE 6, e22084. https://doi.org/10.1371/journal.pone.0022084
Tatters, A.O., Clevenger, C., Strangman, W.K., Oehrle, S., Kudela, R.M., Aukamp, J., Wan, Y., 2025. Benthic cyanobacterial accumulations and associated cyanotoxins in coastal urban stormwater pond networks. Harmful Algae 144, 102833. https://doi.org/10.1016/j.hal.2025.102833
Thomas, M.K., Litchman, E., 2015. Effects of temperature and nitrogen availability on the growth of invasive and native cyanobacteria. Hydrobiologia 763, 357–369. https://doi.org/10.1007/s10750-015-2390-2
Tromas, N., Fortin, N., Bedrani, L., Terrat, Y., Cardoso, P., Bird, D., Greer, C.W., Shapiro, B.J., 2017. Characterising and predicting cyanobacterial blooms in an 8-year amplicon sequencing time course. The ISME Journal 11, 1746–1763. https://doi.org/10.1038/ismej.2017.58
Tsai, K.-P., 2016. Management of target algae by using copper-based algaecides: Effects of algal cell density and sensitivity to copper. Water, Air, & Soil Pollution 227. https://doi.org/10.1007/s11270-016-2926-8
Wahlin, K., Grimvall, A., 2008. Uncertainty in water quality data and its implications for trend detection: Lessons from swedish environmental data. Environmental Science & Policy 11, 115–124. https://doi.org/10.1016/j.envsci.2007.12.001
Wang, Z., Xu, Y., Shao, J., Wang, J., Li, R., 2011. Genes associated with 2-methylisoborneol biosynthesis in cyanobacteria: Isolation, characterization, and expression in response to light. Plos One 6, E18665. https://doi.org/10.1371/journal.pone.0018665
Watson, S.B., 2003. Cyanobacterial and eukaryotic algal odour compounds: Signals or by-products? A review of their biological activity. Phycologia 42, 332–350. https://doi.org/10.2216/i0031-8884-42-4-332.1
Wickham, H., Averick, M., Bryan, J., Chang, W., McGowan, L., François, R., Grolemund, G., Hayes, A., Henry, L., Hester, J., Kuhn, M., Pedersen, T., Miller, E., Bache, S., Müller, K., Ooms, J., Robinson, D., Seidel, D., Spinu, V., Takahashi, K., Vaughan, D., Wilke, C., Woo, K., Yutani, H., 2019. Welcome to the tidyverse. Journal of Open Source Software 4, 1686. https://doi.org/10.21105/joss.01686
Wiedner, C., Visser, P.M., Fastner, J., Metcalf, J.S., Codd, G.A., Mur, L.R., 2003. Effects of light on the microcystin content of Microcystis strain PCC 7806. Applied and Environmental Microbiology 69, 1475–1481. https://doi.org/10.1128/aem.69.3.1475-1481.2003
Winder, M., Sommer, U., 2012. Phytoplankton response to a changing climate. Hydrobiologia 698, 5–16. https://doi.org/10.1007/s10750-012-1149-2
Wörmer, L., Huerta-Fontela, M., Cirés, S., Carrasco, D., Quesada, A., 2010. Natural photodegradation of the cyanobacterial toxins microcystin and cylindrospermopsin. Environmental Science & Technology 44, 3002–3007. https://doi.org/10.1021/es9036012
Xiao, M., Wei, Y., Zheng, D., Shi, L., Huang, C., Wang, Y., Zhu, G., 2024. Outbreak of 2-methylisoborneol in a drinking water reservoir attributed to the cyanobacterium Pseudanabaena sp. Journal of Oceanology and Limnology 42, 1789–1804. https://doi.org/10.1007/s00343-024-4034-8
Xu, H., Brookes, J., Hobson, P., Pei, H., 2019. Impact of copper sulphate, potassium permanganate, and hydrogen peroxide on Pseudanabaena galeata cell integrity, release and degradation of 2-methylisoborneol. Water Research 157, 64–73. https://doi.org/10.1016/j.watres.2019.03.082
Xu, H., Yang, A., Ma, X., Wang, W., Pang, Y., Pei, H., 2024. Molecular mechanisms underlying sodium percarbonate treatment suppress the recovery and growth of Pseudanabaena sp. In early spring. Journal of Hazardous Materials 476, 135145. https://doi.org/10.1016/j.jhazmat.2024.135145
Yahel, G., Yahel, R., Katz, T., Lazar, B., Herut, B., Tunnicliffe, V., 2008. Fish activity: A major mechanism for sediment resuspension and organic matter remineralization in coastal marine sediments. Marine Ecology Progress Series 372, 195–209. https://doi.org/10.3354/meps07688
Yang, Y., Zheng, X., Tang, Q., Gu, J., Lei, L., Han, B.-P., 2020. Species diversity and seasonal dynamics of filamentous cyanobacteria in urban reservoirs for drinking water supply in tropical china. Ecotoxicology 29, 780–789. https://doi.org/10.1007/s10646-020-02189-1
Yu, Z., Song, X., Cao, X., Liu, Y., 2017. Mitigation of harmful algal blooms using modified clays: Theory, mechanisms, and applications. Harmful Algae 69, 48–64. https://doi.org/10.1016/j.hal.2017.09.004
Zhang, M., Yang, Z., Yu, Y., Shi, X., 2020. Interannual and seasonal shift between Microcystis and Dolichospermum: A 7-year investigation in lake chaohu, china. Water 12, 1978. https://doi.org/10.3390/w12071978
Zhi, M., Zhao, Y., Zeng, X., Maddela, N.R., Xiao, Y., Chen, Y., Prasad, R., Zhou, Z., 2023. Filamentous cyanobacteria and hydrophobic protein in extracellular polymeric substances facilitate algae—bacteria aggregation during partial nitrification. International Journal of Biological Macromolecules 251, 126379. https://doi.org/10.1016/j.ijbiomac.2023.126379
Zohary, T., Padisák, J., Naselli-flores, L., 2010. Phytoplankton in the physical environment: Beyond nutrients, at the end, there is some light. Hydrobiologia 639, 261–269. https://doi.org/10.1007/s10750-009-0032-2