Controlling filamentous cyanobacterial blooms requires adaptive, weather-informed strategy

Supplementary Material

Authors
Affiliations

Jiao Fang

Yande Li

Management Station of Shuangxikou Reservoir, Reservoir Management Service Center of Yuyao

Yuying Gui

Yufan Ai

Ogalo Joseph

Tengxin Cao

Shilong He

School of Environment and Spatial Informatics, China University of Mining and Technology

Min Yang

a Key Laboratory of Environmental Aquatic Chemistry, State Key Laboratory of Regional Environment and Sustainability, Research Center for Eco-Environmental Sciences, Chinese Academy of Sciences, Beijing 100085, China.
b School of Environment and Spatial Informatics, China University of Mining and Technology, Xuzhou 221116, China.
c Management Station of Shuangxikou Reservoir, Reservoir Management Service Center of Yuyao, Ningbo 315423, China.
d College of Environmental Science and Engineering, Ocean University of China, Qingdao 266100, China.
e University of Chinese Academy of Sciences, Beijing 100049, China.

* Corresponding to: Ming Su (mingsu@rcees.ac.cn), Min Yang (yangmin@rcees.ac.cn)

Figures and/or tables are provided below as the supplementary evidences to the main text.

Comparative analysis of algal mitigation strategies

Method Genera Advantages Disadvantages Reference
Copper sulfate Microcystis Rapid efficacy Copper ion residuals; Disrupts microbial diversity (Liu et al., 2023)
Copper sulfate Pseudokirchneriella Easy operation High resistance (Tsai, 2016)
Solid sodium percarbonate Pseudanabaena Less impact on microbial diversity Differentiated response (Xu et al., 2021)
Ultrasound Microcystis No chemical additives; Disruption of gas vesicles High energy demand; Ineffective against small algae (Kong et al., 2019)
Ultrasound Hydrodictyon Fragments trichomes Limited effectiveness (Lee et al., 2014)
Aeration/mixing Microcystis Inhibition of surface aggregation Limited effectiveness in emergency situation (He et al., 2024)
Flocculation Microcystis, Pseudanabaena High efficiency Aluminum residuals; Introduction of additional substances; Pre-treatment requirement (Li and Pan, 2015; Xu et al., 2024)
Sediment Resuspension Pseudanabaena Spectral targeting; Eco-sustainability; Cost-effectiveness Threshold limitation; Turbidity increase; Not applicable under sediment contamination this study; (Fang et al., 2024; Su et al., 2025)
Table S1: Comparative analysis of algal mitigation strategies: Conventional versus SR-based approaches.

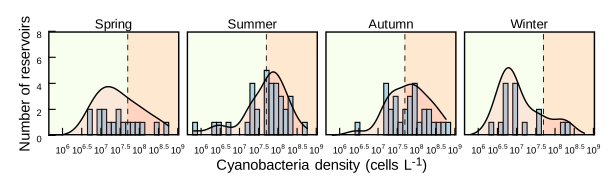
Seasonal distribution of filamentous cyanobacteria density range across 40 reservoirs

Fig. S1: Seasonal distribution of filamentous cyanobacteria density range across 40 reservoirs. Spring through Winter histograms showing reservoir counts (n = 40) binned by cyanobacteria density intervals (cells L-1). Vertical dashed lines indicate critical risk thresholds: green (low risk: < 5 × 10⁷ cells L-1) and orange (moderate risk: > 5 × 10⁷ cells L-1).

Distribution of nutrients concentration range across 40 reservoirs
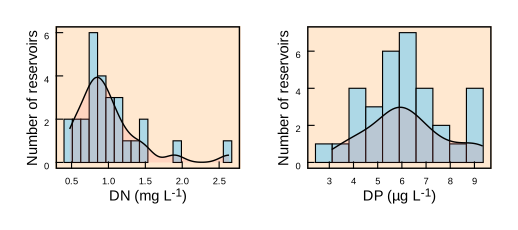
Fig. S2: Distribution of nutrients concentration range across 40 reservoirs. Histograms showing reservoir counts (n = 40) binned by dissolved nitrogen (DN) and dissolved phosphorus (DP) intervals.

Temporal dynamics and statistical distribution of underwater light intensity across experimental treatments

Fig. S3: Temporal dynamics and statistical distribution of underwater light intensity (Ic(0.05m)) across experimental shading treatments. a, High-resolution measurements of underwater light intensity (μmol m-2 s-1) at 0.05 m depth under graduated shading treatments (0 – 98% surface coverage), recorded at 15-min intervals (09:00 – 16:00) during Day 1 of sediment resuspension (SR) deployment. b, Boxplot analysis of light regimes by treatment, showing statistically distinct reductions in Ic(0.05m) relative to unshaded controls.

Temporal dynamics of dissolved nitrogen concentration across experimental treatments
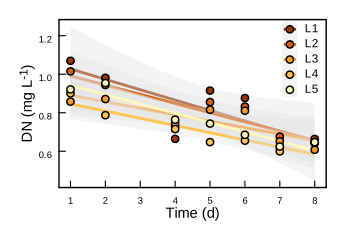
Fig. S4: Temporal dynamics of dissolved nitrogen concentration across experimental treatments

Seasonal variations in mixed layer depth across 40 drinking water reservoirs

Fig. S5: Seasonal variations in mixed layer depth (zmix) across 40 drinking water reservoirs.

Seasonal variations in underwater light available across 40 drinking water reservoirs

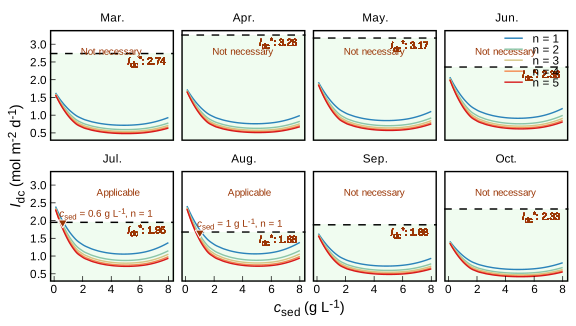
Fig. S6: Seasonal variations in underwater light available (Idc) across 40 drinking water reservoirs.

Seasonal variations in water temperature across 40 drinking water reservoirs
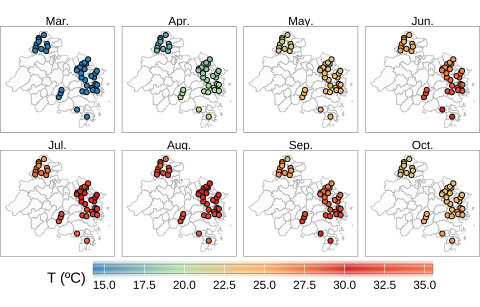
Fig. S7: Seasonal variations in water temperature (T) across 40 drinking water reservoirs.

Seasonal dynamics of predicted filamentous cyanobacteria density and environmental drivers across 40 reservoirs
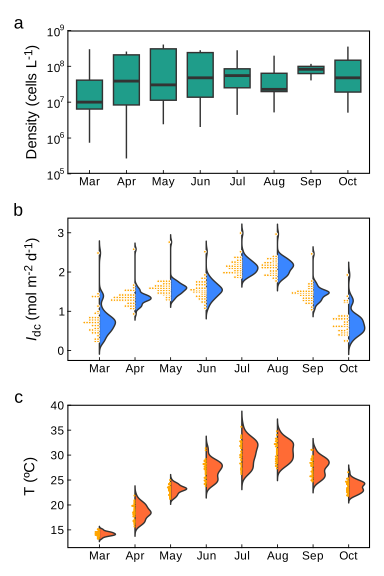
Fig. S8: Seasonal dynamics of predicted filamentous cyanobacteria density and environmental drivers across 40 reservoirs. a, Monthly distributions of predicted filamentous cyanobacteria cell densities (cells L-1) from March to October. b, Corresponding underwater light available (Idc). c, Corresponding underwater temperature (T).

Monthly distribution of predicted filamentous cyanobacteria density risk range across 40 reservoirs
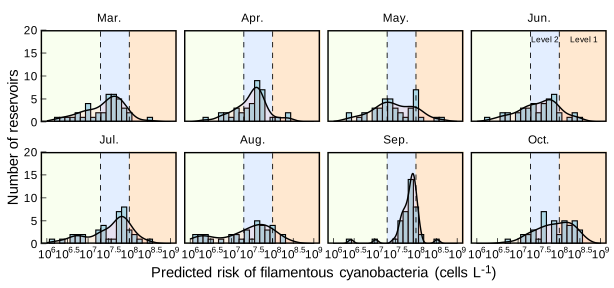
Fig. S9: Monthly distribution of predicted filamentous cyanobacteria density risk range across 40 reservoirs. March through October histograms showing reservoir counts (n = 40) binned by predicted algal density intervals (cells L-1). Vertical dashed lines indicate two risk thresholds: Risk Level 1 (RL1): 1 × 10⁸ cell L-1 and Risk Level 2 (RL2): 2 × 10⁷ cell L-1. The diferent colors represent different risk levels: green (low risk: < RL2), blue (moderate risk: RL2 to RL1) and orange (high risk: > RL1).

Seasonal control rates of filamentous cyanobacteria bloom mitigation across 40 reservoirs

Fig. S10: Seasonal control rates (CR) of filamentous cyanobacteria bloom mitigation across 40 reservoirs. Monthly success rates for reducing predicted filamentous cyanobacteria densities from initial bloom conditions to target Risk Level 2 (\(RL_2\): 2 × 10⁷ cells L-1) within 10 days.

Monthly effectiveness of sediment resuspension for controlling filamentous cyanobacteria blooms across 40 reservoirs
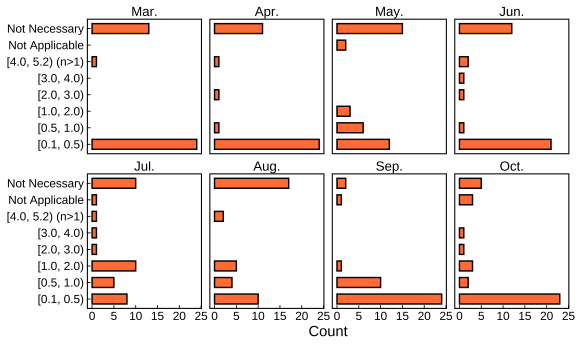
Fig. S11: Monthly effectiveness of sediment resuspension for controlling filamentous cyanobacteria blooms across 40 reservoirs. Monthly plots showing how many reservoirs successfully reduced algal levels below Risk Level 2 (\(RL_2\): 2 × 10⁷ cells L-1) within N (N = 10) days using different sediment resuspension strategies. Each panel represents a month from March to October. The x-axis shows eight sediment resuspension conditions combining two different frequencies (\(n\) = 1 and \(n\) > 1) and six sediment concentration ranges.

Temporal dynamics of underwater light available across bloom stage in S Reservoir
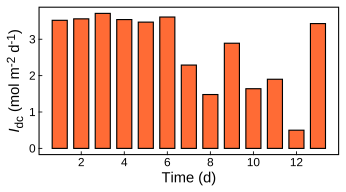
Fig. S12: Temporal dynamics of underwater light available (Idc) across bloom stage in S Reservoir.

Workflow for determining the optimal sediment resuspension (SR) operating conditions
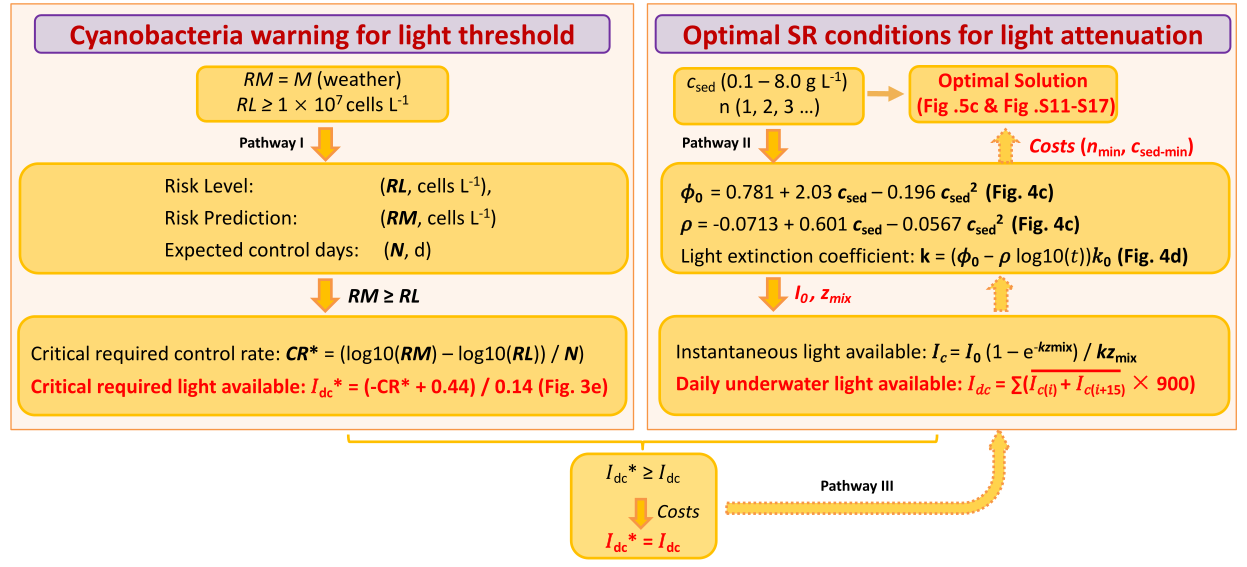
Fig. S13: Workflow for determining the optimal sediment resuspension (SR) operating conditions. It was structured into three pathways: (I) The critical control rate (\(CR^*\)) and light-threshold (\(I_{\text{dc}}^*\)) determination. \(CR^*\) was first determined based upon the bloom risk predictions (\(RM\)) across 40 reservoirs over different months, and the \(I_{\text{dc}}^*\) is derived from the filamentous cyanobacteria control target (Risk Level \(RL\) and Expected control days \(N\)); (II) SR-driven optical attenuation estimation, which calculates achievable \(I_{\text{dc}}\) from extinction coefficient responses (\(k\)) under different sediment concentrations (\(c_{\text{sed}}\)) and resuspension frequencies (\(n\)); (III) Cost-constrained optimization, which identifies the most efficient SR regime by sequentially meeting the criteria (\(I_{\text{dc}} = I_{\text{dc}}^*\), \(n_{\text{min}}\), \(c_{\text{sed(min)}}\)).

Dynamics of nutrients concentration before and during SR in S Reservoir
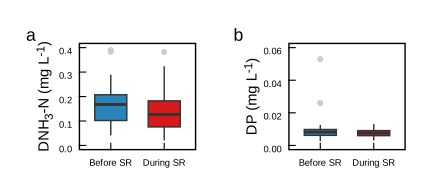
Fig. S14: Dynamics of dissolved ammonia nitrogen and dissolved phosphorus before and during SR in S Reservoir

Field applications in five drinking water reservoirs

Fig. S15: ‎ The comparison of observed total phytoplankton cell densities between sites with Sediment Resuspension (SR) operations (FE) and those without (FC) was conducted across five drinking water reservoirs. Long‐term SR technology was implemented in SMH and SXK Reservoirs to evaluate its effectiveness in preventing cyanobacterial growth (A), while the CX, NJ, and HM Reservoirs underwent short‐term evaluation for cyanobacterial bloom control (B). Panel C illustrates the comparison of Oxidation‐Reduction Potential (ORP) of reservoir sediment and total phosphorus concentration of reservoir water, assessing the effect of long‐term SR on sediment and water quality. Furthermore, panel D depicts the relationship between cell removal rate and SR working intensity, accompanied by several images that document the changes in the water surface of the CX Reservoir following SR operations from day 0 to day 10. Notably, a severe Microcystis bloom in the CX Reservoir provided a vivid visual representation of the changes in the water bodies.

Optimal SR flux for control of filamentous cyanobacterial blooms under various meteorological conditions, bloom intensities and mixed layer

Fig. S16: Optimal SR flux for control of filamentous cyanobacterial blooms under various meteorological conditions (daily surface light intensity, I0, 0 - 20 mol m-2 d-1), bloom intensities (0.8 - 2.8 × 10⁸ cells L-1) and mixed layer depths (8 - 28 m).

Sketch of weather-based implementation of underwater light regulation
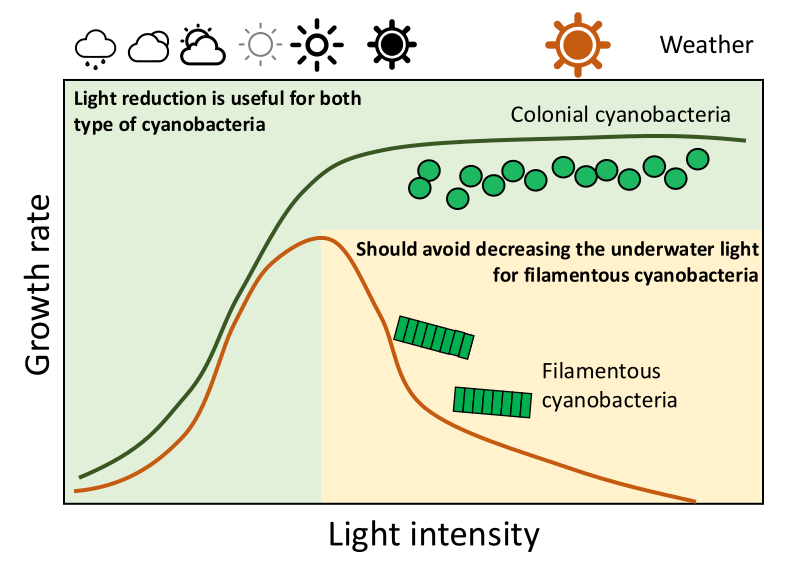
Fig. S17: Sketch of weather-based implementation of underwater light regulation.

Light modulation efficacy for controlling filamentous cyanobacteria blooms with zmix of 6 m under varying solar regimes

No. 1 Light modulation efficacy under initial predicted density of 80 M under zmix of 6 m
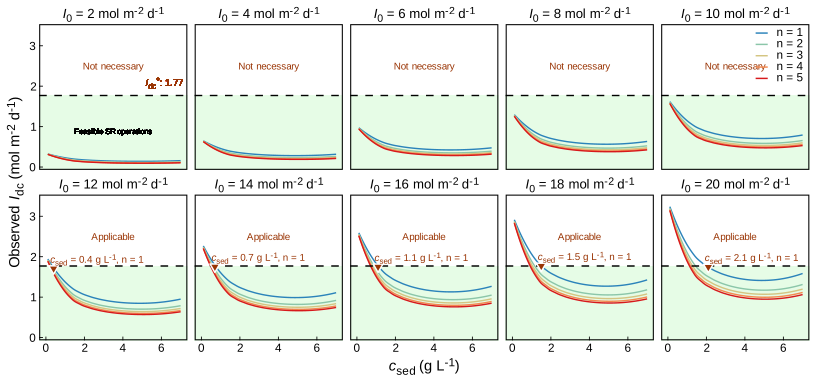
Fig. S18: Light modulation efficacy under initial predicted density of 80 M under zmix of 6 m. Dynamics of underwater irradiance (\(I_{\text{0}}\), 2 - 20 μmol m-2 d-1 etc,.) across sediment resuspension (SR) conditions (x-axis: sediment concentration 0.1 - 8.0 g L-1; color: resuspension frequency 1 - 5 cycles d-1), faceted by incident solar radiation quartiles. Horizontal dashed lines indicate critical light thresholds required to suppress blooms from initial predicted density of 0.8 × 10⁸ cells L-1 to Risk Level 2 (\(RL_{\text{2}}\): 2 × 10⁷ cells L-1) within N (N = 10) days. Brown points denote optimal SR parameters balancing algal control and operational cost (minimal sediment loading).

No. 2 Light modulation efficacy under initial predicted density of 120 M under zmix of 6 m
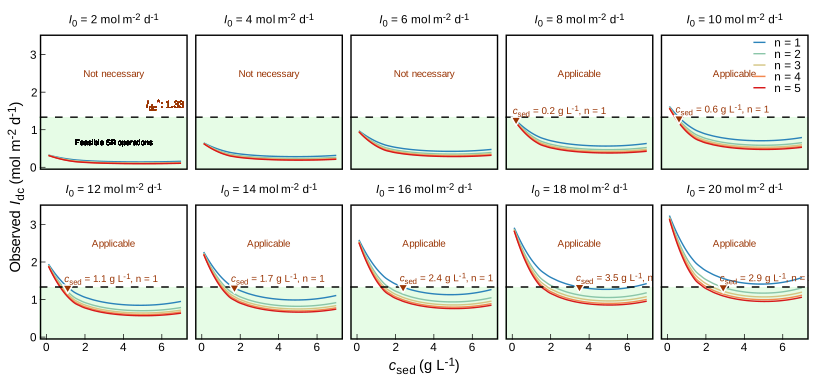
Fig. S19: Light modulation efficacy under initial predicted density of 120 M under zmix of 6 m. Dynamics of underwater irradiance (\(I_{\text{0}}\), 2 - 20 μmol m-2 d-1 etc,.) across sediment resuspension (SR) conditions (x-axis: sediment concentration 0.1 - 8.0 g L-1; color: resuspension frequency 1 - 5 cycles d-1), faceted by incident solar radiation quartiles. Horizontal dashed lines indicate critical light thresholds required to suppress blooms from initial predicted density of 1.2 × 10⁸ cells L-1 to Risk Level 2 (\(RL_{\text{2}}\): 2 × 10⁷ cells L-1) within N (N = 10) days. Brown points denote optimal SR parameters balancing algal control and operational cost (minimal sediment loading).

No. 3 Light modulation efficacy under initial predicted density of 160 M under zmix of 6 m
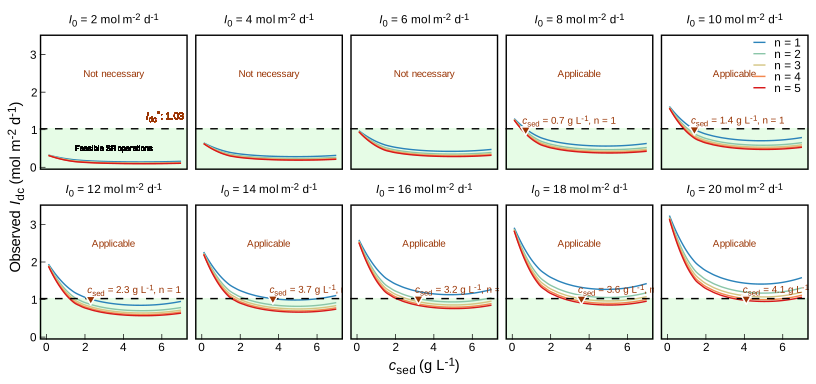
Fig. S20: Light modulation efficacy under initial predicted density of 160 M under zmix of 6 m. Dynamics of underwater irradiance (\(I_{\text{0}}\), 2 - 20 μmol m-2 d-1 etc,.) across sediment resuspension (SR) conditions (x-axis: sediment concentration 0.1 - 8.0 g L-1; color: resuspension frequency 1 - 5 cycles d-1), faceted by incident solar radiation quartiles. Horizontal dashed lines indicate critical light thresholds required to suppress blooms from initial predicted density of 1.6 × 10⁸ cells L-1 to Risk Level 2 (\(RL_{\text{2}}\): 2 × 10⁷ cells L-1) within N (N = 10) days. Brown points denote optimal SR parameters balancing algal control and operational cost (minimal sediment loading).

No. 4 Light modulation efficacy under initial predicted density of 200 M under zmix of 6 m
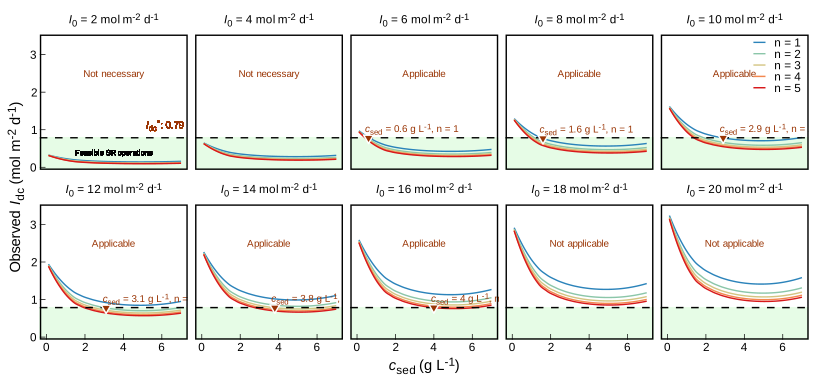
Fig. S21: Light modulation efficacy under initial predicted density of 200 M under zmix of 6 m. Dynamics of underwater irradiance (\(I_{\text{0}}\), 2 - 20 μmol m-2 d-1 etc,.) across sediment resuspension (SR) conditions (x-axis: sediment concentration 0.1 - 8.0 g L-1; color: resuspension frequency 1 - 5 cycles d-1), faceted by incident solar radiation quartiles. Horizontal dashed lines indicate critical light thresholds required to suppress blooms from initial predicted density of 2.0 × 10⁸ cells L-1 to Risk Level 2 (\(RL_{\text{2}}\): 2 × 10⁷ cells L-1) within N (N = 10) days. Brown points denote optimal SR parameters balancing algal control and operational cost (minimal sediment loading).

No. 5 Light modulation efficacy under initial predicted density of 240 M under zmix of 6 m
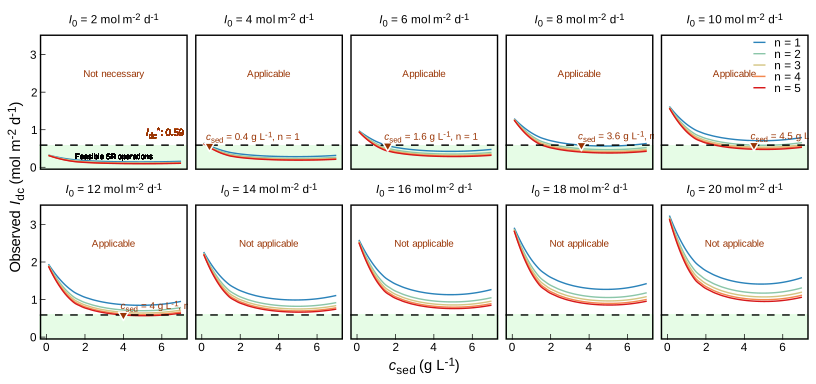
Fig. S22: Light modulation efficacy under initial predicted density of 240 M under zmix of 6 m. Dynamics of underwater irradiance (\(I_{\text{0}}\), 2 - 20 μmol m-2 d-1 etc,.) across sediment resuspension (SR) conditions (x-axis: sediment concentration 0.1 - 8.0 g L-1; color: resuspension frequency 1 - 5 cycles d-1), faceted by incident solar radiation quartiles. Horizontal dashed lines indicate critical light thresholds required to suppress blooms from initial predicted density of 2.4 × 10⁸ cells L-1 to Risk Level 2 (\(RL_{\text{2}}\): 2 × 10⁷ cells L-1) within N (N = 10) days. Brown points denote optimal SR parameters balancing algal control and operational cost (minimal sediment loading).

No. 6 Light modulation efficacy under initial predicted density of 280 M under zmix of 6 m
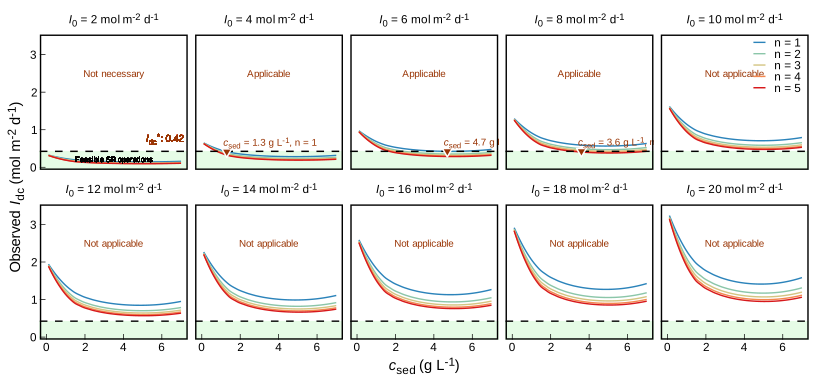
Fig. S23: Light modulation efficacy under initial predicted density of 280 M under zmix of 6 m. Dynamics of underwater irradiance (\(I_{\text{0}}\), 2 - 20 μmol m-2 d-1 etc,.) across sediment resuspension (SR) conditions (x-axis: sediment concentration 0.1 - 8.0 g L-1; color: resuspension frequency 1 - 5 cycles d-1), faceted by incident solar radiation quartiles. Horizontal dashed lines indicate critical light thresholds required to suppress blooms from initial predicted density of 2.8 × 10⁸ cells L-1 to Risk Level 2 (\(RL_{\text{2}}\): 2 × 10⁷ cells L-1) within N (N = 10) days. Brown points denote optimal SR parameters balancing algal control and operational cost (minimal sediment loading).

Observed variations in Pseudanabaena abundance across different light conditions
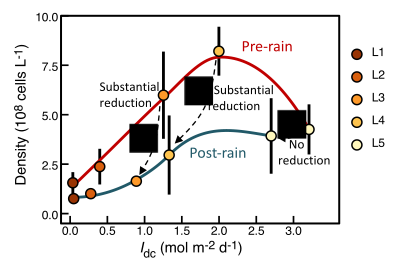
Fig. S24: ‎ A rainfall event reveals how ambient light regulates shading efficacy against filamentous cyanobacteria (Pseudanabaena) Differential impacts of identical shading treatments (L1–L5) on Pseudanabaena biomass during high-light pre-rain (S1) and low-light post-rain (S3) periods.

Growth responses of Microcystis* and filamentous cyanobacteria to light intensity
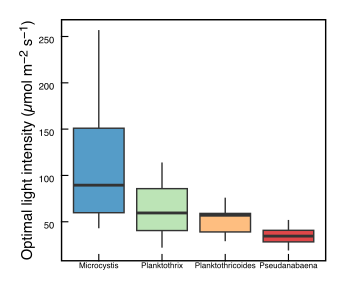
Fig. S25: ‎ Growth responses of Microcystis and filamentous cyanobacteria to light intensity, based on a synthesis of experimental studies.

Optimal sediment resuspension strategies for filamentous cyanobacteria control across seasonal 40 reservoir systems

No. 1 BX Reservoir

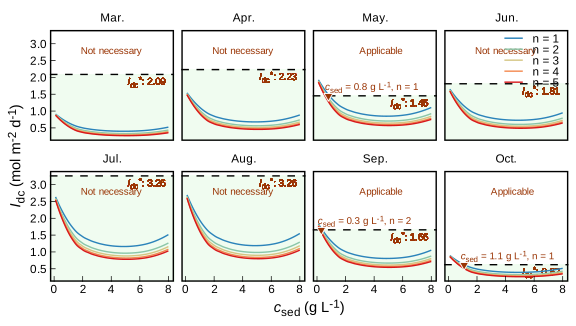
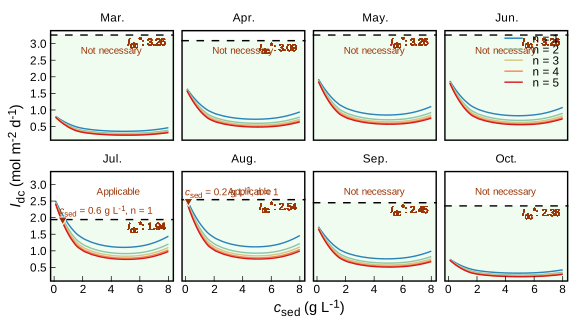
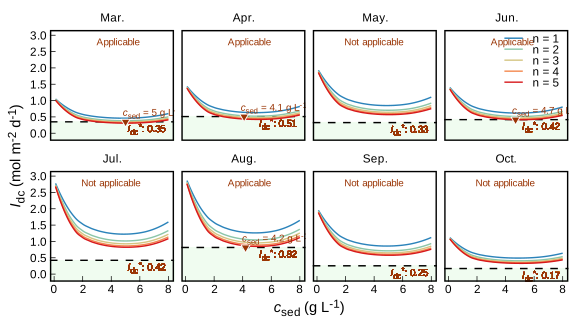
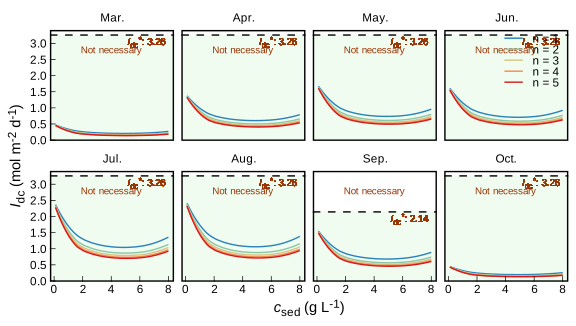
Fig. S26: Underwater light availability (y-axis) under varying sediment resuspension conditions (x-axis: sediment concentration, \(c_{\text{sed}}\); color: resuspension frequency, \(n\)) in BX reservoir (March - October). Horizontal dashed lines indicate month-specific critical light thresholds (\(I_{\text{dc}}\)) required to suppress algal biomass to Risk Level 2 (\(RL_{\text{2}}\): 2 × 10⁷ cells L-1) within N (N = 10) days. Conditions where resuspension-induced light attenuation falls below thresholds (points beneath dashed lines) represent effective algal control scenarios (green aera). Brown points identify optimal operational conditions - meeting critical light requirements while minimizing resuspension frequency, thereby balancing ecological efficacy with operational sustainability. Shaded regions highlight 95% confidence intervals for threshold responses.

No. 2 CAG Reservoir

Fig. S27: Underwater light availability under varying sediment resuspension conditions in CAG reservoir (March - October).

No. 3 CT Reservoir

Fig. S28: Underwater light availability under varying sediment resuspension conditions in CT reservoir (March - October).

No. 4 DH Reservoir

Fig. S29: Underwater light availability under varying sediment resuspension conditions in DH reservoir (March - October).

No. 5 DHK Reservoir

Fig. S30: Underwater light availability under varying sediment resuspension conditions in DHK reservoir (March - October).

No. 6 DTG Reservoir

Fig. S31: Underwater light availability under varying sediment resuspension conditions in DTG reservoir (March - October).

No. 7 EJL Reservoir

Fig. S32: Underwater light availability under varying sediment resuspension conditions in EJL reservoir (March - October).

No. 8 FH Reservoir

Fig. S33: Underwater light availability under varying sediment resuspension conditions in FH reservoir (March - October).

No. 9 FS Reservoir

Fig. S34: Underwater light availability under varying sediment resuspension conditions in FS reservoir (March - October).

No. 10 GXZ Reservoir

Fig. S35: Underwater light availability under varying sediment resuspension conditions in GXZ reservoir (March - October).

No. 11 HCG Reservoir

Fig. S36: Underwater light availability under varying sediment resuspension conditions in HCG reservoir (March - October).

No. 12 HJ Reservoir

Fig. S37: Underwater light availability under varying sediment resuspension conditions in HJ reservoir (March - October).

No. 13 HK Reservoir

Fig. S38: Underwater light availability under varying sediment resuspension conditions in HK reservoir (March - October).

No. 14 HM Reservoir

Fig. S39: Underwater light availability under varying sediment resuspension conditions in HM reservoir (March - October).

No. 15 HP Reservoir

Fig. S40: Underwater light availability under varying sediment resuspension conditions in HP reservoir (March - October).

No. 16 HS Reservoir

Fig. S41: Underwater light availability under varying sediment resuspension conditions in HS reservoir (March - October).

No. 17 HX Reservoir

Fig. S42: Underwater light availability under varying sediment resuspension conditions in HX reservoir (March - October).

No. 18 HXH Reservoir

Fig. S43: Underwater light availability under varying sediment resuspension conditions in HXH reservoir (March - October).

No. 19 LH Reservoir

Fig. S44: Underwater light availability under varying sediment resuspension conditions in LH reservoir (March - October).

No. 20 LHT Reservoir

Fig. S45: Underwater light availability under varying sediment resuspension conditions in LHT reservoir (March - October).

No. 21 LSK Reservoir

Fig. S46: Underwater light availability under varying sediment resuspension conditions in LSK reservoir (March - October).

No. 22 LY Reservoir

Fig. S47: Underwater light availability under varying sediment resuspension conditions in LY reservoir (March - October).

No. 23 MH Reservoir

Fig. S48: Underwater light availability under varying sediment resuspension conditions in MH reservoir (March - October).

No. 24 MX Reservoir

Fig. S49: Underwater light availability under varying sediment resuspension conditions in MX reservoir (March - October).

No. 25 NJ Reservoir

Fig. S50: Underwater light availability under varying sediment resuspension conditions in NJ reservoir (March - October).

No. 26 SA Reservoir

Fig. S51: Underwater light availability under varying sediment resuspension conditions in SA reservoir (March - October).

No. 27 SLH Reservoir

Fig. S52: Underwater light availability under varying sediment resuspension conditions in SLH reservoir (March - October).

No. 28 SLK Reservoir

Fig. S53: Underwater light availability under varying sediment resuspension conditions in SLK reservoir (March - October).

No. 29 SMH Reservoir

Fig. S54: Underwater light availability under varying sediment resuspension conditions in SMH reservoir (March - October).

No. 30 SXK Reservoir

Fig. S55: Underwater light availability under varying sediment resuspension conditions in SXK reservoir (March - October).

No. 31 SXP Reservoir

Fig. S56: Underwater light availability under varying sediment resuspension conditions in SXP reservoir (March - October).

No. 32 SZ Reservoir

Fig. S57: Underwater light availability under varying sediment resuspension conditions in SZ reservoir (March - October).

No. 33 TX Reservoir

Fig. S58: Underwater light availability under varying sediment resuspension conditions in TX reservoir (March - October).

No. 34 TZG Reservoir

Fig. S59: Underwater light availability under varying sediment resuspension conditions in TZG reservoir (March - October).

No. 35 XK Reservoir

Fig. S60: Underwater light availability under varying sediment resuspension conditions in XK reservoir (March - October).

No. 36 XLA Reservoir

Fig. S61: Underwater light availability under varying sediment resuspension conditions in XLA reservoir (March - October).

No. 37 XXN Reservoir

Fig. S62: Underwater light availability under varying sediment resuspension conditions in XXN reservoir (March - October).

No. 38 YML Reservoir

Fig. S63: Underwater light availability under varying sediment resuspension conditions in YML reservoir (March - October).

No. 39 ZGZ Reservoir

Fig. S64: Underwater light availability under varying sediment resuspension conditions in ZGZ reservoir (March - October).

No. 40 ZX Reservoir

Fig. S65: Underwater light availability under varying sediment resuspension conditions in ZX reservoir (March - October).

References

Fang, J., Li, Y., Su, M., Cao, T., Sun, X., Ai, Y., Qin, J., Yu, J., Yang, M., 2024. Mitigating harmful cyanobacterial blooms in drinking water reservoirs through in-situ sediment resuspension. Water Research 267, 122509. https://doi.org/10.1016/j.watres.2024.122509
He, Q., Liu, Z., Li, M., 2024. Effects of aeration induced turbulence on colonial morphology and microcystin release of the bloom-forming cyanoabcterium microcystis. Journal of Oceanology and Limnology 42, 1827–1838. https://doi.org/10.1007/s00343-024-4096-7
Kong, Y., Peng, Y., Zhang, Z., Zhang, M., Zhou, Y., Duan, Z., 2019. Removal of Microcystis aeruginosa by ultrasound: Inactivation mechanism and release of algal organic matter. Ultrasonics Sonochemistry 56, 447–457. https://doi.org/10.1016/j.ultsonch.2019.04.017
Lee, K., Chantrasakdakul, P., Kim, D., Kong, M., Park, K.Y., 2014. Ultrasound pretreatment of filamentous algal biomass for enhanced biogas production. Waste Management 34, 1035–1040. https://doi.org/10.1016/j.wasman.2013.10.012
Li, H., Pan, G., 2015. Simultaneous removal of harmful algal blooms and microcystins using microorganism- and chitosan-modified local soil. Environmental Science & Technology 49, 6249–6256. https://doi.org/10.1021/acs.est.5b00840
Liu, H., Chen, S., Zhang, H., Wang, N., Ma, B., Liu, X., Niu, L., Yang, F., Xu, Y., Zhang, X., 2023. Effects of copper sulfate algaecide on the cell growth, physiological characteristics, the metabolic activity of Microcystis aeruginosa and raw water application. Journal of Hazardous Materials 445, 130604. https://doi.org/10.1016/j.jhazmat.2022.130604
Su, M., Li, W., Fang, J., Cao, T., Ai, Y., Lü, C., Zhao, J., Yang, Z., Yang, M., 2025. Effects of oxygenation resuspension on DOM composition and its role in reducing dissolved manganese in drinking water reservoirs. Environmental Science &amp; Technology. https://doi.org/10.1021/acs.est.5c00235
Tsai, K.-P., 2016. Management of target algae by using copper-based algaecides: Effects of algal cell density and sensitivity to copper. Water, Air, & Soil Pollution 227. https://doi.org/10.1007/s11270-016-2926-8
Xu, H., Pang, Y., Li, Y., Zhang, S., Pei, H., 2021. Using sodium percarbonate to suppress vertically distributed filamentous cyanobacteria while maintaining the stability of microeukaryotic communities in drinking water reservoirs. Water Research 197, 117111. https://doi.org/10.1016/j.watres.2021.117111
Xu, H., Yang, A., Li, Z., Wang, W., Wang, X., Pei, H., 2024. Permanganate-enhanced coagulation for benthic filamentous Pseudanabaena sp. Removal: Control disinfection by-products during subsequent chlorination and prevent regrowth of algal cells in sludge. Journal of Water Process Engineering 64, 105730. https://doi.org/10.1016/j.jwpe.2024.105730