
Establishment of quantitative PCR methods for the quantification of geosmin-producing potential and Anabaena sp. in freshwater systems
# These authors contributed equally to this work.
a Key Laboratory of Environmental Aquatic Chemistry, State Key Laboratory of Regional Environment and Sustainability, Research Center for Eco-Environmental Sciences, Chinese Academy of Sciences., Beijing 100085, China.
b University of Chinese Academy of Sciences., Beijing 100049, China.
c South Australia Water Corporation, Australian Water Quality Centre, Adelaide, SA 5000, Australia.
d Ecology, Evolution and Landscape Sciences, School of Earth and Environment Sciences, Adelaide University, Adelaide nil, Australia.
e Healthscope Pathology SA, Adelaide, SA 5034, Australia.
* Corresponding to: Min Yang (yangmin@rcees.ac.cn)
Abstract
Geosmin has often been associated with off-flavor problems in drinking water, with Anabaena sp. as the major producer. Rapid on-site detection of geosmin producers as well as geosmin is important for timely management responses to potential off-flavor events. In this study, quantitative polymerase chain reaction (qPCR) methods were developed to detect Anabaena sp. and geosmin production potential by designing two primer sets targeting the rpoC1 gene (ARG) and geosmin synthase gene (GSG) in freshwater systems. ARG density determined by qPCR was highly related to microscopic cell counts (\(r^2 = 0.726\), \(p < 0.001\)), with limits of detection and quantification of 0.02 and 0.2 pg DNA, respectively. The relationship between geosmin concentrations measured by gas chromatography-mass spectrometry and GSG copy number was also established (\(r^2 = 0.742\), \(p < 0.001\)), with similar detection limits. The two protocols measured different levels of ARG and GSG copies across freshwater systems with diverse ecological conditions, showing their potential for environmental monitoring. Compared with microscopy and GC-MS, qPCR reduced time to results from several days to a few hours and required less taxonomic expertise.
Introduction
Cyanobacterial blooms occur frequently in lakes and reservoirs over the world and have exerted a serious impact on aquatic ecosystems, human health, and a large range of human activities (Battocchi et al., 2010). Such blooms are often accompanied with the occurrence of taste and odor problems caused by cyanobacterial metabolites such as geosmin (trans-1,10-dimethyl-trans-9-decalol) and MIB (2-methylisoborneol or 1,2,7,7-tetramethyl-exo-bicyclo-[2,2,1]-heptan-2-ol) (Saadoun et al., 2001). Anabaena, a well-known bloom-forming cyanobacterial genus, has been reported to be responsible for 46% of geosmin-related taste and odor events (Krienitz et al., 2002; Kuosa, 1991; Sabour et al., 2005; Sotero-santos et al., 2008). In 2007, a severe Anabaena bloom occurred in Yanghe Reservoir in north China, resulting in a serious water supply crisis due to the production of high concentration of geosmin (Li et al., 2010). Cyanobacteria grow exponentially forming blooms and forming large visible biomass within a short period of time. Moreover, cyanobacterial metabolites like geosmin are volatile and susceptible to biodegradation in water (Ho et al., 2007). Therefore a quick or even on-site detection method would be desirable during a taste and odor event, especially in the case of an extensive sampling (Battocchi et al., 2010). Microscopic count, which has long been the major approach used for the monitoring of algae in lakes and reservoirs (Hotzel and Croome, 1994), is very time-consuming (Rodenacker et al., 2001). In addition, the limitation of morphological identification criteria has sometimes rendered it difficult to assign cyanobacteria to a certain genus or species (Humbert et al., 2010), and the reliability of data depends largely on the skill and taxonomic expertise of the operators (Christensen et al., 2009). On the other hand, on-site detection of the odor compounds is generally not practicable as the equipment (usually gas chromatography-mass spectrophotometry (GC-MS)) used for this purpose are large machines and not transportable in the field (Deng et al., 2011).
Quantitative polymerase chain reaction (qPCR) has been proven to be reliable, robust, sensitive and fast (Rasmussen et al., 2008b; Rinta-kanto et al., 2005), which may be suitable for the on-site survey of cyanobacterial blooms. In comparison with the 16S rRNA genes, which has been used extensively for the design of primers for cyanobacterial detection (Matsunaga et al., 2001; Rocap et al., 2002; Steindler et al., 2005), the gamma-unit of the DNA-dependent RNA polymerase (\(rpoC_1\)) gene could be a more discriminatory marker to assign cyanobacterial cultures/isolates at the genus or even the species levels (Bergsland and Haselkorn, 1991; Fergusson and Saint, 2000; Innok et al., 2005; Palenik and Haselkorn, 1992). This gene has been employed for rapid on-site monitoring of Cylindrospermopsis raciborskii by using qPCR in reservoirs (Marbun et al., 2012). With regard to geosmin, the geosmin synthase gene has been discovered recently, which is responsible for biosynthesis of geosmin in cyanobacteria. It has provided the fundamental knowledge to investigate into the relationship between geosmin production potential and geosmin synthase gene (GSG) expression (Cane et al., 2006; Cane and Watt, 2003; Giglio et al., 2008; Gust et al., 2003; Jiang et al., 2007, 2006). Moreover, the growth conditions affecting the expression of GSG in A. circinalis have been examined (Giglio et al., 2011). These two genes would be good candidates for the development of specific PCR assays for the detection of Anabaena sp. and also other potential geosmin producers in the environment.
In this study, two PCR primer sets were designed to amplify a fragment of the Anabaena \(rpoC_1\) gene (ARG) and GSG homologs, respectively. The specificities of the \(rpoC_1\)-based primer set (ARG primers) and geosmin synthase gene based primer set (GSG primers) were verified by testing 47 and 11 cyanobacterial cultures, respectively. Both PCR assays were validated with a culture-based experiment using a geosmin-producing strain (A. circinalis AWQC-ANA318) over a period of 72 days, as well as 63 field samples (7 sites \(\times\) 3 repeats \(\times\) 3 levels) spiked with different levels of Anabaena (A. spiroides FADC-0001). This study provides a valuable on-site technique for the early monitoring of geosmin-producing Anabaena.
Materials and methods
Cyanobacterial cultures
Thirty Anabaena strains, fifteen Microcystis strains and two Cylindrospermopsis strains obtained from Australian Water Quality Centre (AWQC), Freshwater Algae Culture Collection of the Institute of Hydrobiology (FACHB) and Chinese Research Academy of Environmental Sciences (CRAES) were used to test the specificity of ARG primers (Table 1, the AWQC-strains were performed in AWQC in 2009, while the FACHB/FADC-strains were performed in Beijing in 2012); on the other hand, eleven Anabaena strains were used to test the specificity of GSG primers (Table 2). A. circinalis strain AWQC-ANA318 was used to simulate a cyanobacterial bloom in a laboratory culture system. The strain was isolated at the AWQC in 1995 from a sample sourced from Pejar Dam in Goulburn, NSW, Australia, during a taste and odor episode (Giglio et al., 2011); In addition, A. spiroides strain FADC-0001 was used to validate the qPCR methods on field samples with A. spiroides supplemented. This strain was isolated at Chinese Research Academy of Environmental Sciences (CRAES) from Yanghe Reservoir in north China, during a cyanobacterial bloom in 2007. The reason for choosing these two strains was that they belong to the two major bloom-forming species in South Australia (SA) (Llewellyn et al., 2001) and China, respectively (Li et al., 2010; Pan et al., 2009).
The AWQC-ANA318 strain was grown under continuous illumination (2500 lux) for 72 days at 25 \(\mathrm{^\circ C}\) without agitation in two crystal plastic containers 10 L, Nalgene) in ASM-1 medium (Provasoli et al., 1957), and the initial cell density of the two cultures were at 1277 and 6436 cells mL\(^{-1}\), respectively. The cultures were sampled every 2 to 8 days for cell enumeration under light microscopy, geosmin analysis by GC-MS and DNA extraction for qPCR assays (the sampling was performed every 2 or 3 days in the lag phase and log phase, and the frequency decreased in the other phases; the longest interval was 8 days). On the other hand, the FADC-0001 strain was initially grown in BG-11 medium under continuous illumination for one week (Rippka et al., 1979), and subsequently added to the field samples collected from 5 freshwater ponds and 2 rivers in Beijing for qPCR applicability validation.
| Strain | Genus/species | Sig. | Source |
|---|---|---|---|
| FACHB-170 | Anabaena cylindrica | ++ | FACHB |
| FACHB-190 | Anabaena azollae | - | FACHB |
| FACHB-245 | Anabaena flos-aquae | ++ | FACHB |
| FACHB-251 | Anabaena sphaerica | + | FACHB |
| FACHB-319 | Anabaena variabilis | - | FACHB |
| FACHB-362 | Anabaena catenula | \(+^*\) | FACHB |
| FACHB-380 | Anabaena inaequalis | \(+^*\) | FACHB |
| FACHB-1096 | Cylindrospermopsis sp. | - | FACHB |
| FACHB-1194 | Anabaena eucompacta | \(+^*\) | FACHB |
| FACHB-1199 | Anabaena eucompacta | - | FACHB |
| FACHB-1219 | Anabaena sp. | \(+^*\) | FACHB |
| FACHB-1239 | Anabaena sp. | ++ | FACHB |
| FACHB-1250 | Anabaena sp. | ++ | FACHB |
| FACHB-1255 | Anabaena flos-aquae | ++ | FACHB |
| FACHB-1263 | Anabaena flos-aquae | ++ | FACHB |
| FADC-0001 | Anabaena spiroides | + | CRAES |
| FADC-0002 | Microcystis sp. | - | CRAES |
| AWQC-ANA318 | Anabaena circinalis | + | AWQC |
| AWQC-ANA001 | Anabaena cylindrica | + | AWQC |
| AWQC-ANA019 | Anabaena circinalis | + | AWQC |
| AWQC-ANA025 | Anabaena oscillarioides | + | AWQC |
| AWQC-ANA044 | Anabaena spiroides | + | AWQC |
| AWQC-ANA048 | Anabaena affinis | + | AWQC |
| AWQC-ANA049 | Anabaena circinalis | + | AWQC |
| AWQC-ANA051 | Anabaena flos-aquae | + | AWQC |
| AWQC-ANA056 | Anabaena spiroides | + | AWQC |
| AWQC-ANA059 | Anabaena circinalis | + | AWQC |
| AWQC-ANA217 | Anabaena aphanizomeniodes | + | AWQC |
| AWQC-ANA249 | Anabaena inaequalis | + | AWQC |
| AWQC-ANA283 | Anabaena bergii | - | AWQC |
| AWQC-ANA357 | Anabaena azollae | - | AWQC |
| AWQC-ANA374 | Anabaena planktonica | + | AWQC |
| AWQC-MIC005 | Microcystis aeruginosa | - | AWQC |
| AWQC-MIC013 | Microcystis aeruginosa | - | AWQC |
| AWQC-MIC017 | Microcystis aeruginosa | - | AWQC |
| AWQC-MIC029 | Microcystis aeruginosa | - | AWQC |
| AWQC-MIC034 | Microcystis aeruginosa | - | AWQC |
| AWQC-MIC040 | Microcystis aeruginosa | - | AWQC |
| AWQC-MIC049 | Microcystis aeruginosa | - | AWQC |
| AWQC-MIC311 | Microcystis aeruginosa | - | AWQC |
| AWQC-MIC320 | Microcystis aeruginosa | - | AWQC |
| AWQC-MIC051 | Microcystis flos-aquae | - | AWQC |
| AWQC-MIC053 | Microcystis flos-aquae | - | AWQC |
| AWQC-MIC054 | Microcystis flos-aquae | - | AWQC |
| AWQC-MIC055E | Microcystis flos-aquae | - | AWQC |
| AWQC-MIC058 | Microcystis flos-aquae | - | AWQC |
| AWQC-CYL001 | Cylindrospermopsis raciborskii | - | AWQC |
The gel results of amplifications using conventional PCR with ARG primers AN03/06.
+, positive result; \(+^*\), the gel showed weak signal; ++, gel showed strong signal.
The ARG primers didn’t amplify the DNA.
Field sites, sampling and cell enumeration
In order to assess the impact of biomass and particles in water on the quantification of ARG and GSG by qPCR, 5 freshwater aquaculture ponds (Weiming Lake (WML), Forest Park (FP), Yuyuantan (YYT), Houhai (HH) and Lotus Ponds (LP)) and 2 rivers (Wenyu River (WYR) and Qing River (QR)) spreading over 5 districts in Beijing, China were chosen (Figure A.1). The pH, conductivity and salinity were determined on-site using a YSI probe (YSI6600, USA). In total, 63 water samples (7 sites \(\times\) 3 levels \(\times\) 3 repeats) were taken from the surface water (0.5 m) at each site. All field samples were supplemented with different concentrations (range from \(10^6-10^8\) cells L\(^{-1}\)) of the FADC-0001 strain before analysis. Together with 32 culture samples collected from the laboratory culture system, all samples were used for cell enumeration, geosmin determination and DNA extraction.
Subsamples for cell enumeration were preserved with Lugol’s iodine to a final concentration of 5% (Sherr and Sherr, 1993) and then kept in dark until cell counting. The algal cell density was determined by the Utermöhl technique using a Sedgewick-Rafter counting chamber under a Nikon Eclipse 50i microscope with phase contrast and bright field illumination (Hasle, 1978). A magnification of 160\(\times\) and 400\(\times\) was used to identify and enumerate the cells, respectively. For each sample, triplicates of 1 mL each culture were collected and counted separately.
Geosmin analysis
Filtration through poly-carbonate filters was used to separate the dissolved from the intracellular geosmin fraction of all samples. Subsamples for dissolved geosmin determination were passed through a poly-carbonate membrane (3 \(\mathrm{\mu m}\) pore size, 47 mm diameter, Millipore, Bedford, Mass) applying a vacuum (quantify under 40 kPa); while unfiltered sample represent the total geosmin. Both filtered and unfiltered fractions were stored in light-blocking bottles with airtight stopper supplemented with HgCl\(_2\) to a final concentration of 10 mg L\(^{-1}\) to prevent biodegradation (Li et al., 2010), and then analyzed within 24 h using the solid phase micro-extraction (SPME) method coupled with gas chromatography-mass spectrometry (GC-MS) (Agilent 6890/5975, Agilent Tech., USA) (Deng et al., 2011; Liang et al., 2005). Intracellular geosmin concentrations were calculated by subtracting dissolved geosmin from the total geosmin values.
DNA extraction
Subsamples for genomic DNA extraction from both culture and field samples were filtered through a 5 \(\rm{\mu}\)m hydrophilic Durapore filter (Millipore, Bedford, Mass) until the filtration pads were saturated. The filters were then placed into a sterile tube (Axygen, USA) with 180 \(\rm{\mu}\)L of lysis buffer (DNeasy Kit 69504, Qiagen, Australia), and the cells were then broken using an ultrasonic peen with 6 cycles of 15 seconds on and 10 seconds off at 20% power (DIGITAL Sonifier S-250D, Branson, Dabury, USA). Additionally, to optimize cell lysis, 10 \(\rm{\mu}\)L of lysozyme solution (90 mg mL\(^{-1}\), Invitrogen, USA) and 10 \(\rm{\mu}\)L proteinase K (DNeasy Kit 69504, Qiagen, Australia) were added to the cell preparation, and placed for incubation at 56 \(\rm{^\circ C}\) for 3 h. Finally, DNA extraction was completed using the DNeasy Blood & Tissue Kit (Qiagen, USA) following the protocol provided by the manufacturer. The purity of the extracted DNA varied from 1.7 to 1.9 was assessed by calculating the ratio of the absorbance measured at 260 nm (A260) to the absorbance measured at 280 nm (A280), using NanoDrop1000 spectrophotometer version 3.2.1 software (Biolab).
Primers design and specificity evaluation
For the general detection of Anabaena populations and their geosmin production potential, two qPCR primer sets were designed which respectively amplify specific fragments of the \(rpoC_1\) gene coding for the gamma subunit of the RNA polymerase of Anabaena sp. and geosmin synthase gene responsible for the biosynthesis of geosmin in cyanobacteria. The sequences are as follows: ARG forward primer AN03 (5’-TGTGGCTCATGTTTGGTATCTC-3’) and reverse primer AN06 (5’-CCAATACCCACTTCCACACC-3’); GSG forward primer 173AF (5’-TGTGAGTACCCAAGAGG-3’) and 173AR (5’-CTGCCAATCCTGAAGTCCTTT-3’) (Giglio et al., 2011).
As shown in Table 1, thirty Anabaena strains, fifteen Microcystis strains and two Cylindrospermopsis strains were used to test the specificity of the ARG primer set with conventional PCR coupled with gel electrophoresis (agarose 1% v/v). At the same time, eleven Anabaena strains were used to verify the specificity of the GSG primer set; in addition, a melting curve analysis, which was developed in 1990s and has been used to distinguish different PCR products based on GC/AT ratio, length and sequence recently (Rasmussen et al., 2007; Ririe et al., 1997), was run at the end of qPCR runs to verify the melting temperature (\(T_m\)) of the amplicons for the four AWQC strains (AWQC-ANA044/102/196/328). The \(T_m\) corresponding to the target amplicon is 83 \(\mathrm{^\circ C}\) for \(Anabaena\) species and 86 \(\mathrm{^\circ C}\) for the positive control of Nostoc sp.. So only the samples showed a unique peak at the right temperature (83 \(\mathrm{^\circ C}\)) were considered as positive (Table 2). The 25 \(\mathrm{\mu L}\) PCR mixture included 1\(\times\) PCR buffer (Takara, Dalian, China), 0.2 \(\mathrm{\mu L}\) dNTPs (Takara, Dalian, China), 1.25 U of Taq DNA polymerase (Takara, Dalian, China), 0.2 \(\mu\)M of each primer (AN03/06 for ARG qPCR assay, 173AF/AR for GSG qPCR assay) and 2 \(\mathrm{\mu}\)L of template DNA. The amplification conditions were as follows: an initial denaturation step of 95 \(\mathrm{^\circ C}\) for 5 min, followed by 35 cycles of 95 \(\mathrm{^\circ C}\) for 30 s, 50 \(\mathrm{^\circ C}\) for 30 s, and 72 \(\mathrm{^\circ C}\) for 30 s, and a final extension step of 72 \(\mathrm{^\circ C}\) for 10 min. The PCR products were then used to run gel electrophoresis.
Standards for qPCR analysis and qPCR protocol
The DNA extracted from two strains AWQC-ANA318 and FADC-0001 were used as standards for both qPCR assays. The standard curves were determined by correlation between target genes (copy number in one reaction) and threshold cycle (\(C_T\)) value in a ten-fold serial dilution of Anabaena DNA. The laboratory culture and field samples were subsequently qualified based on their \(C_T\) values. Eq. 1 is the calculation of Anabaena genome copy number (\(\mathcal{N}\)) in one qPCR reaction.
\[ \mathcal{N}\ (\mathrm{copy})=\frac{N_\mathrm{A}\ (\mathrm{copy\ mol^{-1}})\ c_{DNA}\ (\mathrm{ng\ \mu L^{-1}})\ v_{DNA} (\mathrm{\mu L})}{\mathcal{L}\ (\mathrm{bp})\ \mathcal{M}_{DNA}\ (\mathrm{g\ mol^{-1}\ bp^{-1}})}\times 10^{-9} \ (\mathrm{g\ ng^{-1}}) \tag{1}\]
In this equation, \(N_\mathrm{A}\) represents Avogadro constant, \(c_{DNA}\) represents the DNA template concentration in ng \(\mathrm{\mu L^{-1}}\), \(v_{DNA}\) represents the DNA template volume in one qPCR reaction, \(\mathcal{L}\) represents the Anabaena genome length in base pair (bp) and \(\mathcal{M}_{DNA}\) represents the molecular mass of 1 bp dsDNA. In this study, the calculations are based on a genome size of 4.5 Mb bp for Anabaena sp. (Moustafa et al., 2009), and single copy \(ARG\) and \(GSG\) present in one Anabaena genome (Bergsland and Haselkorn, 1991; Xie et al., 1989).
The qPCR reactions were performed on four replicates using a Rotor-Gene Q instrument (Qiagen, Venlo, Netherlands). Each qPCR reaction was performed in 25 \(\mathrm{\mu}\)L which consisted of 1.5 mM MgCl\(_2\) (Invitrogen, USA), 1\(\times\) PCR buffer (Invitrogen, USA), 0.2 mM dNTPs (Invitrogen, USA), 0.2 \(\mu\)M of each primer (AN03/06 for ARG qPCR, 173AF/AR for GSG qPCR), 1 U of Platinum Taq DNA polymerase (Invitrogen, USA), 2 \(\mathrm{\mu}\)L of template DNA, and 2.5 \(\mathrm{\mu}\)M SYTO9 (Invitrogen, USA). The amplification conditions were as follows: an initial denaturation step of 95 \(\mathrm{^\circ C}\) for 5 min, followed by 45 cycles of 95 \(\mathrm{^\circ C}\) for 30 s, 52 \(\mathrm{^\circ C}\) for 30 s, and 72 \(\mathrm{^\circ C}\) for 30 s, and a final extension step of DNA melting analysis from 75 \(\mathrm{^\circ C}\) to 95 \(\mathrm{^\circ C}\), with data being acquired every degree with a 10 s hold at each step. All data were acquired on the “FAM3” channel, with excitation at 470 nm and emission at 510 nm.
Statistics
The log-log regression, t-test, ANOVA and the figures in this study were performed using the R 2.13.1 system for statistical analysis (R Development Core Team, 2011).
Results and Discussion
Applicability of the designed primers
In order to evaluate the specificity of the AN03/06 primers, genomic DNA from 30 Anabaena strains and 17 other strains was firstly amplified by conventional PCR. Gel electrophoresis was performed for all the amplification products to verify the length of the amplicons. Five Anabaena strains (FACHB-190, FACHB-319, FACHB-1199, AWQC-ANA283, AWQC-ANA357) belonging to A. azollae, A. variabilis, A. eucompacta and A. bergii failed to give positive amplifications, while all the other Anabaena strains showed positive results with a single band at the right size around 200 bp (only the gel electrophoresis results of FACHB-collections and FADC-collections are shown in Figure A.2), although the bands of four strains (FACHB-362 A. catenula, FACHB-380 A. inaequalis, FACHB-1194 A. eucompacta and FACHB-1219 A. sp.) were relatively weak on gel. On the other hand, no amplification product was observed for Microcystis strains and Cylindrospermopsis strains (Table 1). The results imply that the ARG primers are capable of amplifying most Anabaena species. It should be noted that, the \(rpoC_1\) gene of three frequently reported bloom-forming species of A. circinalis (strain AWQC-ANA318), A. spiroides (strain FADC-0001) and A. flos-aquae could be well amplified by the ARG primers.
As shown in Table 2, six of 11 Anabaena strains possessing geosmin producing potentials (1.97-8270 ng L\(^{-1}\)) exhibited positive PCR results on gel electrophoresis, while the other 5 strains showing no geosmin producing potential (less than 1.0 ng L\(^{-1}\)) exhibited negative results (only the results of FACHB-collections and FADC-0001 are shown in Figure A.3). In addition, the melting curve analysis results exhibited distinct different in the melting temperatures (T\(_\textrm{m}\)) between the amplicon of Nostoc sp. (86 \(^\circ\)C) and those of the four AWQC Anabaena strains (83 \(^\circ\)C), showing that the melting analysis may also be used for differentiating the Anabaena species between each other. Overall, the GSG primers are capable of amplifying the geosmin synthesis genes of the Anabaena species by coupling with melting curve analysis, and that could be used as a potential tool for geosmin detection in natural water bodies.
In 2003 a sesquiterpene protein domain in Streptomyces coelicolor A3(2) was linked to the presence of the taste and odor compound geosmin (Cane and Watt, 2003; Gust et al., 2003). Since then the gene responsible for the biosynthesis of geosmin (geo gene) has been extensively characterized (Cane et al., 2006; Jiang et al., 2007, 2006). In 2007 two geoA-like genes were detected in a strain of Phormidium (cyanobacteria, Oscillatoriales) (Ludwig et al., 2007) but their function in cyanobacteria were not elucidated until full characterization of the geoA gene was performed in Nostoc punctiforme (Giglio et al., 2008). Since then the expression of these genes has been studied in a single strain of Anabaena (Giglio et al., 2011), which was demonstrated that the expression of the geosmin gene appears to be constitutive in nature. While in recent years some studies established quantitative PCR assays to detect and measure the production of geosmin by Streptomycetes in the environment (Auffret et al., 2011; Lylloff et al., 2012); to the best of our knowledge, no peer reviewed study has displayed a quantitative PCR assay to detect the production of geosmin specifically by cyanobacteria. The present study is the first qPCR assays for the detection and quantification of the cyanobacterial geosmin synthase in waters. Moreover, the ARG qPCR assay allows the detection of several Anabaena species, major bloom-forming genus and confirmed geosmin producers. Combined, these two assays allow the monitoring of the population of Anabaena at the same time as the production of geosmin. The comparison of the two results therefore assists in determining if Anabaena is responsible for the release of geosmin in the environment.
| Strain | Genus/species | Sig. | Geosmin (\(\mathbf{ng\ L^{-1}}\)) |
|---|---|---|---|
| AWQC-ANA044 | Anabaena spiroides | + | 1.97 |
| AWQC-ANA102 | Anabaena flos-aquae | + | 4.05 |
| AWQC-ANA196 | Anabaena circinalis | + | 472.16 |
| AWQC-ANA328 | Anabaena circinalis | + | 204.36 |
| FACHB-1199 | Anabaena eucompacta | - | \(<\)LOD |
| FACHB-1219 | Anabaena sp. | - | \(<\)LOD |
| FACHB-1239 | Anabaena sp. | + | 8270 |
| FACHB-1250 | Anabaena sp. | - | \(<\)LOD |
| FACHB-1255 | Anabaena sp. | - | \(<\)LOD |
| FACHB-1263 | Anabaena flos-aquae | - | \(<\)LOD |
| FADC-0001 | Anabaena spiroides | + | 305.1 |
| Positive control | Nostoc sp. | + | + |
| Negative control | Milli-Q water | - | 0.09 |
Conventional PCR used GSG primers 173AF/AR; the melting temperature (\(\mathrm{T_m}\)) corresponding to the target amplicon is 83 \(\mathrm{^\circ C}\) for Anabaena species and 86 \(\mathrm{^\circ C}\) for Nostoc species.
The concentration of geosmin produced by the strains was measured by GC-MS;
The geosmin concentration determined by GC-MS method is under the limit of detection (LOD);
The positive control has been previously controlled for the production of geosmin and was found positive with a different melting temperature of 86 \(\mathrm{^\circ C}\);
There was residual geosmin in the water serving for analysis (0.09 ng L\(^{-1}\)), thus for the strains for which the level of geosmin detected were around 1 ng L\(^{-1}\) is not possible to confirm true positive from negative.
Validation of the qPCR assays
The limit of detection (LOD) and limit of quantification (LOQ) of both ARG and GSG qPCR assays were obtained by testing the 10 fold serial dilutions of AWQC-ANA318 genomic DNA range from 0.02 pg (approx. 4 genome copy) to 2.0\(\times 10^4\) pg (approx. 4\(\times 10^{6}\) genome copy) DNA in one qPCR reaction. As shown in Table 3, the standard errors of \(C_T\) values were increasing along with the fold number dilutions of DNA, which results in an increasing error of qPCR results. Over 90% of the DNA samples showed fluorescence signals for both assays at a DNA concentration over 0.02 pg level; On the other hand, 25% or lower coefficient of variation (CV) of \(C_T\) values were obtained at 0.2 pg DNA level for both assays. Thus, the LOD and LOQ of both methods were 0.02 pg DNA and 0.2 pg DNA, respectively. The LOQ of 0.2 pg is around 40 copy number of target gene in one reaction for both qPCR assays, suggesting that the methods are capable of determining low concentration of target genes in natural samples.
| Assay | DNA quantity (pg) | \(C_T\) | Gene copies | CV (%) | Positive samples (%) | Below LOD? | Below LOQ? |
|---|---|---|---|---|---|---|---|
| ARG | 0.02 | 34.7 +/- 0.63 | 4.34 | 42 | 94 | No | Yes |
| ARG | 0.2 | 31.4 +/- 0.32 | 39.5 | 25 | 100 | No | No |
| ARG | 2 | 28.0 +/- 0.18 | 380 | 13 | 100 | No | No |
| ARG | 20 | 24.4 +/- 0.10 | 4.65e3 | 7 | 100 | No | No |
| ARG | 200 | 21.6 +/- 0.15 | 3.28e4 | 11 | 100 | No | No |
| ARG | 2,000 | 18.0 +/- 0.14 | 3.93e5 | 10 | 100 | No | No |
| ARG | 20,000 | 15.0 +/- 0.09 | 3.15e6 | 6 | 100 | No | No |
| GSG | 0.02 | 37.7 +/- 0.37 | 4.35 | 28 | 96 | No | Yes |
| GSG | 0.2 | 34.6 +/- 0.22 | 37.9 | 17 | 100 | No | No |
| GSG | 2 | 31.2 +/- 0.16 | 410 | 11 | 100 | No | No |
| GSG | 20 | 27.9 +/- 0.05 | 4.08e3 | 3 | 100 | No | No |
| GSG | 200 | 24.7 +/- 0.08 | 3.83e4 | 6 | 100 | No | No |
| GSG | 2,000 | 21.2 +/- 0.10 | 4.51e5 | 7 | 100 | No | No |
| GSG | 20,000 | 18.3 +/- 0.05 | 3.51e6 | 4 | 100 | No | No |
Standard curves and linearity for the quantification of Anabaena sp. and geosmin using qPCR
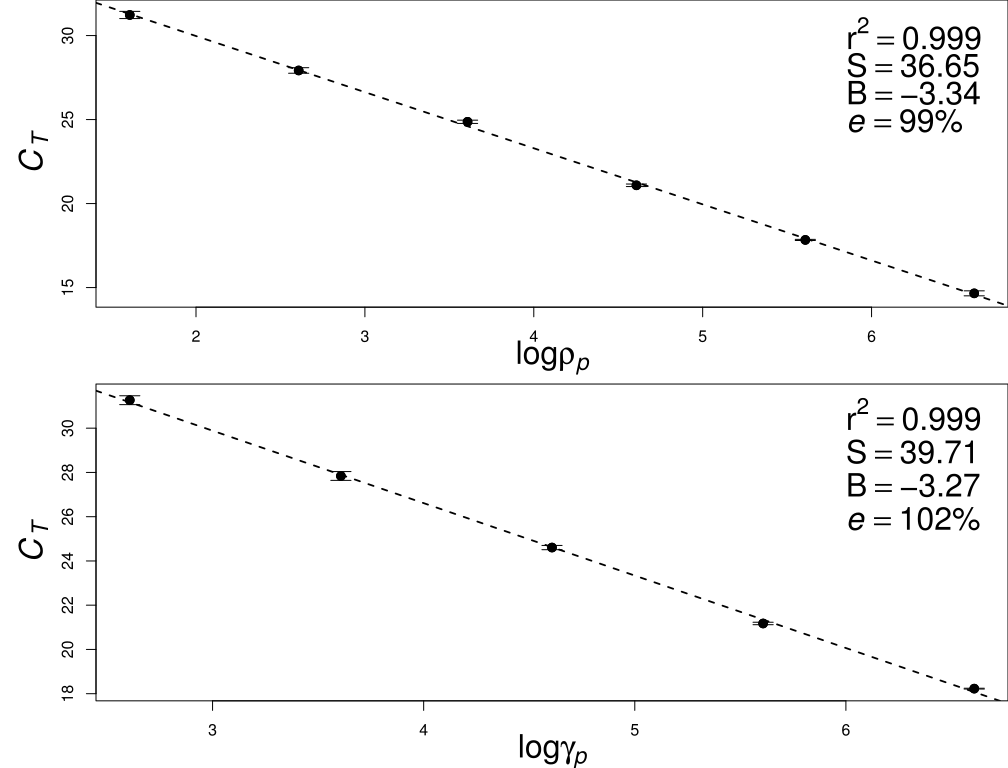
According to LOQ of both qPCR assays, the standard curves were constructed with 10 fold serial dilution of extracted genomic DNA from the AWQC-ANA318 strain and FADC-0001 strain (data not shown), respectively (Fig. 1). The range of DNA concentration in one reaction is from 0.2 pg (40 copies) to 20 ng (4.0\(\mathrm{\times 10^6}\) copies) for ARG qPCR, and from 2 pg (400 copies) to 20 ng (4.0\(\mathrm{\times 10^6}\) copies) for GSG qPCR assay. The following linear relationships between cycle threshold (\(C_T\)) and the log of the gene copies were obtained: \(C_T=-3.34\log \rho_p+36.65\) (r\(^2\)=0.999) with an efficiency of 99% for ARG qPCR assay and \(C_T=-3.27\log \gamma_p+39.71\) (r\(^2\)=0.999) with an efficiency of 102% for GSG qPCR assay, respectively. These results proved that the two qPCR assays developed in this study are reliable for the quantification of Anabaena population and geosmin producing potential.
Quantification of ARG and comparison with microscopic count
Using DNA extracted from 32 AWQC-ANA318 culture samples from the laboratory simulated bloom, amplification results for the ARG qPCR assay were compared to cell density determined by microscopic count.
In vitro study
Two independent AWQC-ANA318 cultures named AE1 and AE2 were used to simulate the Anabaena blooms in laboratory. The initial cell densities of the two cultures were 1.28 ($$0.09) \(\times 10^6\) and 6.44 ($$0.04) \(\times 10^6\) cells L\(^{-1}\) (microscopic count), respectively (Fig. 2, solid line); the cultures were then kept in log-phase for three weeks, forming a bloom-like population. Though the concentrations of the two independent cultures were initially different, the cell density showed no significant difference after 4 weeks (p=0.13), when the stationary-phase started. From week 5 to week 8, both cultures showed a slight decrease of cell density; however, a second growth phase occurred for both cultures, most likely due to the release of the nutrients from dead cells.
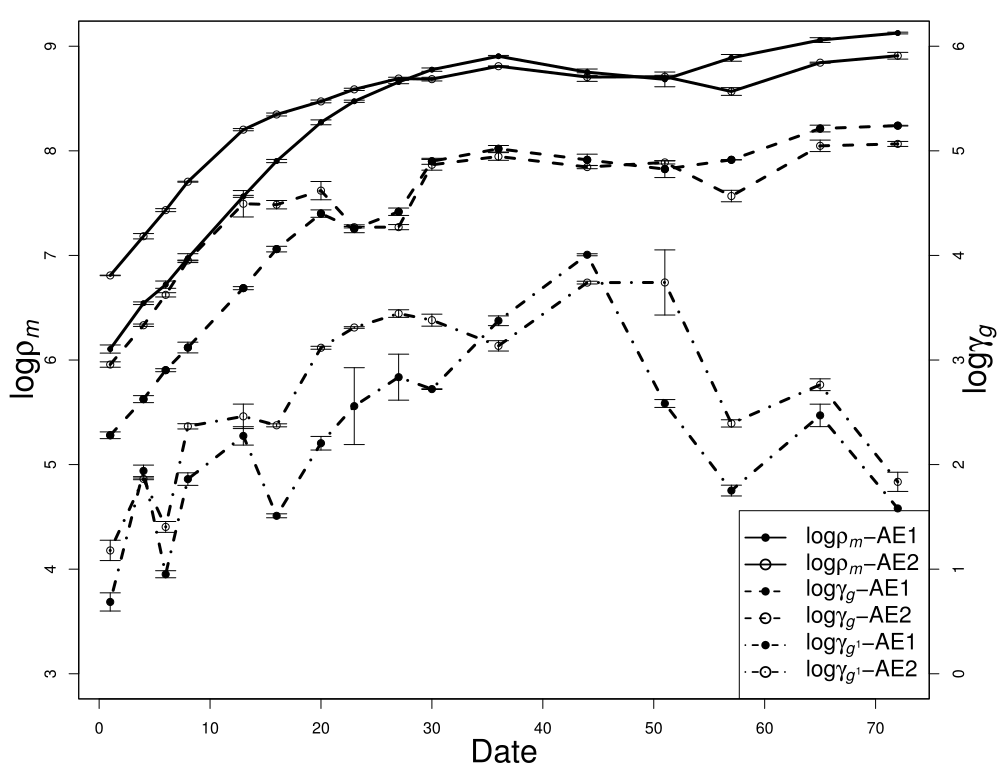
During the simulated Anabaena bloom, the cell density of the AWQC-ANA318 cultures varied from approximately 1\(\times 10^6\) to 1\(\times 10^9\) cells L\(^{-1}\) (Fig. 2); on the other hand, the ARG concentrations, obtained by ARG qPCR assay, varied from 1\(\times 10^6\) to 1\(\times 10^{11}\) copies L\(^{-1}\). A positive log-log correlation was found between the data sets determined by the two different methods (\(\mathrm{r^2}=0.726, \mathrm{p}<0.001\)), as shown in Eq. 2.
\[ \log(\mathrm{\rho_m})=0.6346\log(\mathrm{\rho_p})+1.919 \tag{2}\]
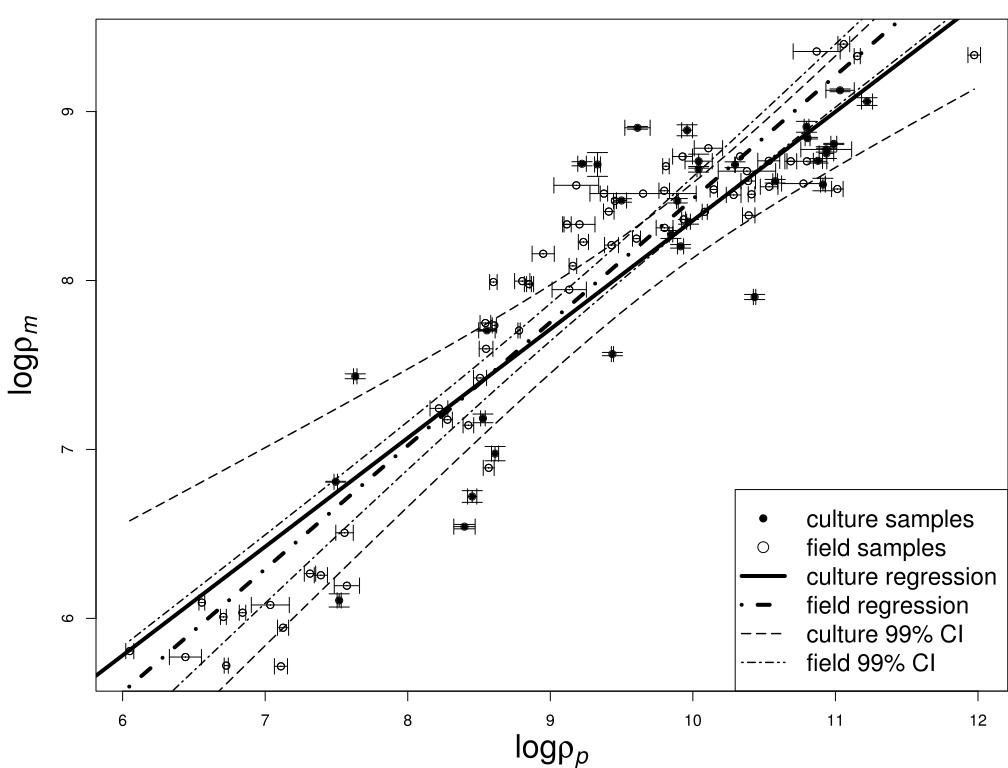
In this equation \(\mathrm{\rho_p}\) and \(\mathrm{\rho_m}\) represent respectively the Anabaena \(rpoC_1\) gene density obtained from the qPCR method and the cell density determined by microscopic count. At the same time, the comparison was plotted in Fig. 3 (filled circle), where the thick solid line is the log-log regression line, and the two thin long dashed lines are the 99% confidence interval (CI). According to the equation, approximately 5 to 100 ARG copies were present in one AWQC-ANA318 cell.
Validation on field samples
In order to evaluate the inhibition factor linked to the quality of field water samples, 63 field samples were tested using both methods; the samples were collected from 5 freshwater ponds and 2 rivers which showed greatly dissimilar physiochemical properties and ecological bio-community compositions. As shown in Table 4, QR showed the lowest pH level (6.71) and highest conductivity (1.192 ms \(\mathrm{\mu s^{-1}}\)) and salinity (0.59 ng L\(^{-1}\)), and contained diverse algal species with Fragilaria as the dominant one (Morales, 2005); HH exhibited the highest pH and low salinity and conductivity, and was dominated by Melosira, a filamentous diatom with thick cell walls; FP and LP exhibited high algal density and were dominated by Lyngbya, which could temporarily monopolize aquatic ecosystems when they form dense floating mats in water (Beer et al., 1986); WML was dominated by Pediastrum, a genus of green algae commonly present in freshwater microhabitats (Haas, 1996). Chlamydomonas, a genus of green algae consisting of unicellular flagellates (Harris et al., 1989), was dominant in YYT; and Euglena, a widely studied member of the phylum Euglenozoa (Cramer and Myers, 1952), was dominant in WYR. With regard to bio-community characteristics, only 4 species were observed in QR with a diversity index of 1.46; however, FP, LP, YYT and WML showed a much higher Richness index (Colwell, 2009) around 20, while the diversity index (Shannon et al., 1949) varied from 1.35 to 10.62, implying a greatly dissimilar traits between sites.
| Site | Depth (m) | Salinity | pH | Conductivity | Algal density (cells L-1) | Dominant genus | Other present genera | Richness | S-W index |
|---|---|---|---|---|---|---|---|---|---|
| WML | <5 | 0.29 | 7.14 | 0.598 | 8,925,000 | Pediastrum | Chlorococcales, Synedra, Scenedesmus, Diatoma | 18 | 6.44 |
| FP | <3 | 0.29 | 7.14 | 0.598 | 461,100,000 | Lyngbya | Synedra, Scenedesmus, Merismopedia, Selenastrum | 22 | 1.99 |
| YYT | <4 | 0.20 | 7.09 | 0.414 | 9,390,000 | Chlamydomonas | Cyclotella, Scenedesmus, Melosira, Diatoma | 19 | 10.62 |
| HH | <2 | 0.20 | 7.82 | 0.420 | 2,600,000 | Melosira | Diatoma, Cyclotella, Pediastrum, Scenedesmus | 16 | 8.41 |
| LP | <5 | 0.39 | 7.25 | 0.797 | 301,700,000 | Lyngbya | Aphanocapsa, Merismopedia, Scenedesmus, Pediastrum | 20 | 1.35 |
| WYR | - | 0.41 | 7.53 | 0.834 | 4,701,000 | Euglena | Frustulia, Aphanizomenon, Synedra, Cyclotella | 8 | 1.63 |
| QR | - | 0.59 | 6.71 | 1.192 | 4,750,000 | Fragilaria | Cyclotella, Scenedesmus, Melosira | 4 | 1.46 |
The field samples were initially spiked with different concentrations of FADC-0001 cells, then the cell density was determined by microscopic count, and the ARG density was obtained by ARG qPCR assay. An analysis of variance (ANOVA) was performed to evaluate the effects of the background biomass. \(\iota_1\) (=\(\log(\rho_p/\rho_m)\)) is logarithmic ARG copy density normalized by cell density, the mean \(\iota_1\) of each site are in the range of 1.17 (FP) to 1.54 (QR), and the ANOVA result showed no significant difference between the sites (F=1.003, p=0.43, Figure A.4). The evaluation of the effect from the cell density on amplification was performed using the ANOVA; the samples were grouped by 3 levels (L\(_1\): bottom 1/3, $<\(8.0\)^7$ cells L\(^{-1}\), L\(_2\): middle 1/3, $<\(3.3\)^8$ cells L\(^{-1}\) and L\(_3\): top 1/3, $<\(3.0\)^9$ cells L\(^{-1}\) ) of FADC-0001 cell density, showing no significant difference between L\(_1\) and L\(_2\) (F=1.614, p=0.212), but significant difference between L\(_1\)/L\(_2\) and L\(_3\) (F=13.7, p$<$0.01). The results indicate that the impact of the inhibition due to the background biomass was not the most important issue here, while Anabaena cell density should be taken into consideration to get a better estimation.
The compared data are shown in Fig. 3 (hollow circle), where the thick dot-dashed line is the log-log regression model, and the thin dot-dashed curves are the 99% CI. The qPCR results were in agreement with microscopic count (\(\log\rho_m=0.7301\log\rho_p\)+1.181, r\(^2=0.906\), p$<$0.001); furthermore, the regression line of field samples was consistent with that of culture sample, indicating that the ARG qPCR assay is a good potential tool to track down the Anabaena population in natural water bodies.
Previous studies have established qPCR methods for the quantification of algal cells in water with a correlation coefficient between 0.6 and 0.9 (Behets et al., 2007; Koskenniemi et al., 2007). In comparison, this study has used a larger sample set, and it provides a relatively high correlation coefficient, which could be attributed to the highly discriminatory \(rpoC_1\) gene providing sufficient sequence variation to assign more specifically cyanobacteria. Thus, the ARG qPCR assay represents a useful tool to track down Anabaena especially during a bloom episode.
Quantification of GSG and comparison with the GC-MS results
Laboratory study
The geosmin concentrations of two independent AWQC-ANA318 cultures are shown in Fig. 2 (intracellular geosmin: dashed line, extracellular geosmin: dotted line); the intracellular geosmin increased along with the bloom stage and cell density, while the extracellular geosmin concentration increased during the first 7 weeks, and then decreased to a very low level after 3 weeks. The intracellular geosmin concentrations of these cultures were in the range from 1\(\times 10^2\) to 1\(\mathrm{\times 10^5}\) ng L\(^{-1}\), thus the GSG qPCR assay was valid for the quantification of geosmin production. However, most of geosmin (82.9%-100.0%, data shown in Table A.1) was present within the cells, which was consistent with previous reports (Giglio et al., 2011; Li et al., 2010; Wu and Jüttner, 1988; Zhang et al., 2009), thus the intracellular geosmin is more representative of the population growth and health.
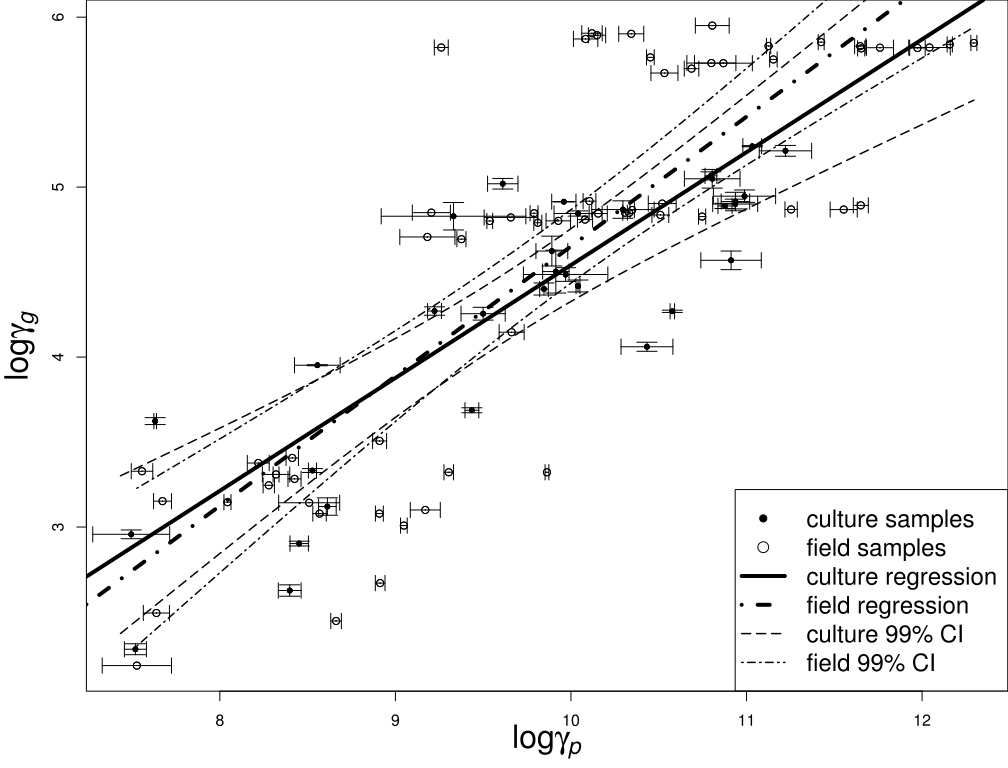
On the other hand, the GSG density in culture samples was determined by GSG qPCR assay, which was then compared with the geosmin concentration measured by GC-MS. We found that the GSG density exhibited stronger correlation with the intracellular geosmin concentration (r\(^2\)=0.742, p$<\(0.01, @eq-gsg) than extracellular geosmin (r\)^2\(=0.253, p\)<$0.01, Figure A.6), possibly due to the rapid biodegradation of extracellular geosmin (Li et al., 2010).
\[ \log(\mathrm{\gamma_g})=0.664\log(\mathrm{\gamma_p})-2.100 \tag{3}\]
In this equation \(\mathrm{\gamma_g}\) represents the intracellular geosmin concentration obtained by GC-MS method in ng L\(^{-1}\) and \(\mathrm{\gamma_p}\) represents the GSG copy number obtained by qPCR method in copies L\(^{-1}\). Fig. 4 shows the comparison between GSG copy number (\(\mathrm{\gamma_p}\), x-axis) and intracellular geosmin concentration (\(\mathrm{\gamma_g}\), y-axis) of the culture samples. According to the log-log model, the intracellular geosmin production potential was in the range of 1 to 40 fg geosmin per copy GSG. (Li et al., 2010) reported that the average geosmin production potential for Anabaena spiroides cells during a bloom in 2007 was approximately 0.1 pg cell\(^{-1}\).
Validation on field study
The 63 field samples spiked with FADC-0001 cells were used to evaluate the applicability of GSG qPCR assay on environmental samples, by comparing the obtained results with geosmin concentration determined by GC-MS. Firstly, ANOVA was performed to analyze the impact of the background biomass. \(\iota_2\) (\(=\log(\gamma_g/\gamma_p)\)) is the logarithmic geosmin production potential of single GSG copy, the mean \(\iota_2\) of all sites are in the range of 4.96 (QR) to 5.7 (WML, Figure A.5), and the ANOVA showed no significant difference between the sites (F=2.27, p=0.053).
Fig. 4 illustrates the comparison between the GSG copy numbers determined by qPCR and geosmin concentration; the results were significantly correlated (\(\log\gamma_g=0.763\log\gamma_p\)-2.98, r\(^2\)=0.694, p$<\(0.001, thick dot-dashed line). Compared to culture samples (filled circle), the field samples (hollow circle) showed a wider distribution pattern. The highest intracellular geosmin was about 1\)^6$ ng L\(^{-1}\), which is beyond the range of the culture samples and such concentration usually rarely occurs in natural waters; at this level, the GSG density showed a much higher variance than the geosmin concentration measured by GC-MS, which could be due to the inhibition caused by high concentration of DNA. As a follow-up research of the expression of GSG in A. circinalis (Giglio et al., 2011), this study provides justification for the use of the GSG qPCR method as a useful predictive tool to evaluate the geosmin production in fresh water.
Methods applicability analysis
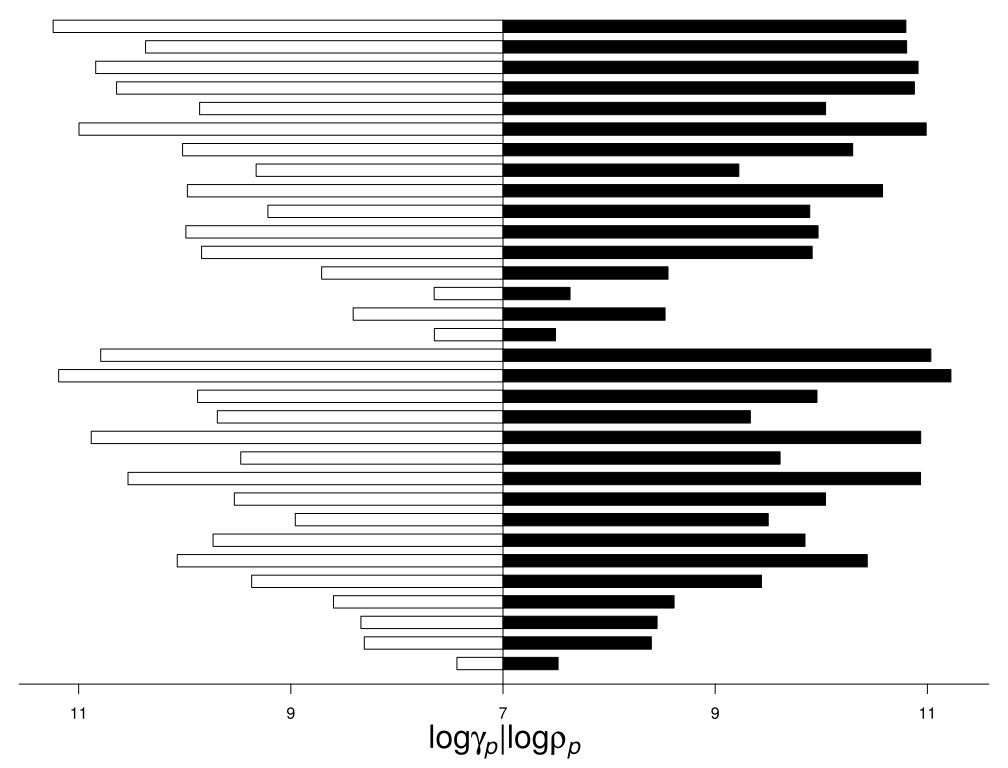
Although the two qPCR assays exhibited the capabilities to estimate the Anabaena population level and geosmin concentration, respectively, relatively high variances were observed in qPCR assays in comparison with the traditional microscopic counting and GC-MS analysis methods, which could compromise the applicability of the qPCR assay methods. Therefore identifying the potential sources of variances is very important in this study. On one hand, the field samples were consistent with the culture samples, implying the inhibition by background biomass is not the major cause; on the other hand, there was very high consistency between the ARG and GSG densities in both the culture (Fig. 5, \(r^2=0.9455,p<0.001\)) and field samples (Figure A.7), implying that the main variances are caused by DNA extraction other than the amplification process (since the two qPCR assays shared the sample DNA in this study). In addition, apart from the fact that inhibition is usually more important with high concentration of DNA in qPCR assays, the increased variability observed on the samples with high DNA concentration could be explained by the fact that the commercial DNA extraction kit used for this study was not well adapted for the extraction of samples with high density cells (the reason could be the variance of DNA concentration is strongly affected by operation steps of DNA extraction, while commercial DNA extraction kit usually has 10 to 20 steps to get a high extraction efficiency, but also raises the variances greatly). Therefore, a simple (less steps) method for DNA extraction with relative lower efficiency is a potential solution. A microwave-based method has been shown to be promising for the extraction of cyanobacterial DNA for qPCR amplifications (Orsini and Romano-spica, 2001; Rasmussen et al., 2008a); moreover, the two qPCR assays developed in the present study are capable of determining low concentration of DNA as they both have low LODs. Thus, the micro-based method would very likely be applicable in conjunction with the two qPCR assays.
Recent studies have shown that the qPCR assay could be used for the quantification of the toxic Microcystis sp. (Rinta-kanto et al., 2005), and cylindrospermopsin-producing cyanobacteria (Behets et al., 2007). In comparison with the approaches proposed in the previous studies, the method developed in this study allows the simultaneous detection of the Anabaena sp. and the geosmin-producing potential using the same qPCR protocol. This merit is very important since quantifying both the odor-causing algae and their odor production potential will be necessary during an odor episode caused by algae. In addition, the ARG and GSG primers are specific to the \(rpoC_1\) gene and geosmin synthase gene, which are corresponding to amplify several important Anabaena species including A. circinalis, A. spiroides and A. flos-aquae etc., and Anabaena geosmin-producing potentials, respectively; besides, the LODs and LOQs were very low for both assays, making it possible to track down all Anabaena blooming stages even under the presence of abundant other algal species. Thus, the two assays represent a useful tool to evaluate the Anabaena population and its contribution to the release of geosmin in natural water.
Conclusion
The opportunity for rapid monitoring of potential geosmin-producing Anabaena sp. could greatly improve the capacity for management of freshwater resources used for both drinking water supplies and other uses such as industry and aquaculture. The present work provided two qPCR assays able to identify Anabaena sp., a major taste and odor producing cyanobacteria as well as the geosmin synthase gene in freshwater system for the first time in a peer reviewed study. Both assays were proved to be reliable and showed a good correlation with cell density and geosmin concentration using microscope and GC-MS techniques, respectively. These two assays represent reliable new tools for the monitoring of geosmin-producing Anabaena populations.
Acknowledgements
We greatly thank CRAES for providing two strains FADC-0001 and FADC-0002 in this study. We would like to express our gratitude to the National Natural Science Foundation of China (50938007) and Sinotropia project (6002GJHZ1203), and the AWQC for their support during this study. We would like also to thank the Australian Department of Innovation, Industry, Science and Research for the funding of this work (funding agreement CH080202).
Declaration of competing interest
The authors declare that they have no known competing financial interests or personal relationships that could have appeared to influence the work reported in this paper.
References
Auffret, M., Pilote, A., Proulx, Émilie, Proulx, D., Vandenberg, G., Villemur, R., 2011. Establishment of a Real-time PCR method for quantification of geosmin-producing Streptomyces spp. In recirculating aquaculture systems. Water Research 45, 6753–6762. https://doi.org/10.1016/j.watres.2011.10.020
Battocchi, C., Totti, C., Vila, M., Masó, M., Capellacci, S., Accoroni, S., Reñé, A., Scardi, M., Penna, A., 2010. Monitoring toxic microalgae ostreopsis (dinoflagellate) species in coastal waters of the mediterranean sea using molecular PCR-based assay combined with light microscopy. Marine Pollution Bulletin 60, 1074–1084. https://doi.org/10.1016/j.marpolbul.2010.01.017
Beer, S., Spencer, W., Bowes, G., 1986. Photosynthesis and growth of the filamentous blue-green-alga Lyngbya-birgei in relation to its environment. Journal of Aquatic Plant Management 24, 61–65.
Behets, J., Declerck, P., Delaedt, Y., Verelst, L., Ollevier, F., 2007. A duplex Real-time PCR assay for the quantitative detection of Naegleria fowleri in water samples. Water Research 41, 118–126. https://doi.org/10.1016/j.watres.2006.10.003
Bergsland, K.J., Haselkorn, R., 1991. Evolutionary relationships among eubacteria, cyanobacteria, and chloroplasts: Evidence from the \(rpoC_1\) gene of anabaena sp. Strain PCC 7120. Journal of Bacteriology 173, 3446–3455.
Cane, D.E., He, X., Kobayashi, S., ömura, S., Ideda, H., 2006. Geosmin biosynthesis in streptomyces avermitilis. Molecular cloning, expression, and mechanistic study of the germacradienol/geosmin synthase. The Journal of antibiotics 59, 471–479.
Cane, D.E., Watt, R.M., 2003. Expression and mechanistic analysis of a germacradienol synthase from Streptomyces coelicolor implicated in geosmin biosynthesis. Proceedings of the National Academy of Sciences 100, 1547–1551. https://doi.org/10.1073/pnas.0337625100
Christensen, E.R., Kusk, K.O., Nyholm, N., 2009. Dose-response regressions for algal growth and similar continuous endpoints: Calculation of effective concentrations. Environmental Toxicology and Chemistry 28, 826–835. https://doi.org/10.1897/08-068r.1
Colwell, R.K., 2009. Biodiversity: Concepts, patterns, and measurement. The Princeton Guide to Ecology 257–63.
Cramer, M., Myers, J., 1952. Growth and photosynthetic characteristics of euglena gracilis. Archiv Für Mikrobiologie 17, 384–402. https://doi.org/10.1007/bf00410835
Deng, X., Liang, G., Chen, J., Qi, M., Xie, P., 2011. Simultaneous determination of eight common odors in natural water body using automatic purge and trap coupled to gas chromatography with mass spectrometry. Journal of Chromatography A 1218, 3791–3798. https://doi.org/10.1016/j.chroma.2011.04.041
Fergusson, K.M., Saint, C.P., 2000. Molecular phylogeny of Anabaena circinalis and its identification in environmental samples by PCR. Applied and Environmental Microbiology 66, 4145–4148. https://doi.org/10.1128/aem.66.9.4145-4148.2000
Giglio, S., Jiang, J., Saint, C.P.S., Cane, D.E., Monis, P.T., 2008. Isolation and characterization of the gene associated with geosmin production in cyanobacteria. Environmental Science & Technology 42, 8027–8032. https://doi.org/10.1021/es801465w
Giglio, S., Saint, C.P., Monis, P.T., 2011. Expression of the Geosmin Synthase gene in the cyanobacterium Anabaena circinalis AWQC318. Journal of Phycology 47, 1338–1343. https://doi.org/10.1111/j.1529-8817.2011.01061.x
Gust, B., Challis, G.L., Fowler, K., Kieser, T., Chater, K.F., 2003. PCR-targeted Streptomyces gene replacement identifies a protein domain needed for biosynthesis of the sesquiterpene soil odor geosmin. Proceedings of the National Academy of Sciences 100, 1541–1546. https://doi.org/10.1073/pnas.0337542100
Haas, J.N., 1996. Neorhabdocoela oocytes - palaeoecological indicators found in pollen preparations from holocene freshwater lake sediments. Review of Palaeobotany and Palynology 91, 371–382. https://doi.org/10.1016/0034-6667(95)00074-7
Harris, E.H., Stern, D.B., Witman, G.B., 1989. The chlamydomonas sourcebook. Cambridge Univ Press.
Hasle, G.R., 1978. A. Sournia (ed) phytoplankton manual, Diatom. Unesco (Paris).
Ho, L., Hoefel, D., Bock, F., Saint, C.P., Newcombe, G., 2007. Biodegradation rates of 2-methylisoborneol (MIB) and geosmin through sand filters and in bioreactors. Chemosphere 66, 2210–2218. https://doi.org/10.1016/j.chemosphere.2006.08.016
Hotzel, G., Croome, R., 1994. Long-term phytoplankton monitoring of the darling river at burtundy, new-south-wales - incidence and significance of cyanobacterial blooms. Australian Journal of Marine and Freshwater Research 45, 747–759.
Humbert, J.f., Quiblier, C., Gugger, M., 2010. Molecular approaches for monitoring potentially toxic marine and freshwater phytoplankton species. Analytical and Bioanalytical Chemistry 397, 1723–1732. https://doi.org/10.1007/s00216-010-3642-7
Innok, S., Matsumura, M., Boonkerd, N., Teaumroong, N., 2005. Detection of Microcystis in lake sediment using molecular genetic techniques. World Journal of Microbiology and Biotechnology 21, 1559–1568. https://doi.org/10.1007/s11274-005-7893-y
Jiang, J., He, X., Cane, D.E., 2007. Biosynthesis of the earthy odorant geosmin by a bifunctional streptomyces coelicolor enzyme. Nature chemical biology 3, 711–715.
Jiang, J., He, X., Cane, D.E., 2006. Geosmin biosynthesis. Streptomyces coelicolor germacradienol/germacrene d synthase converts farnesyl diphosphate to geosmin. Journal of the American Chemical Society 128, 8128–8129. https://doi.org/10.1021/ja062669x
Koskenniemi, K., Lyra, C., Rajaniemi-wacklin, P., Jokela, J., Sivonen, K., 2007. Quantitative Real-time PCR detection of toxic Nodularia cyanobacteria in the Baltic Sea. Applied and Environmental Microbiology 73, 2173–2179. https://doi.org/10.1128/aem.02746-06
Krienitz, L., Ballot, A., Wiegand, C., Kotut, K., Codd, G., Pflugmacher, S., 2002. Cyanotoxin-producing bloom of Anabaena flos-aquae, Anabaena discoidea and Microcystis aeruginosa (Cyanobacteria) in Nyanza Gulf of Lake Victoria, Kenya. Journal of Applied Botany-Angewandte Botanik 76, 179–183.
Kuosa, H., 1991. A bloom of the blue-green alga anabaena lemmermannii-var-minor nostocophyceae in the gennarbyviken fresh-water reservoir southern finland. Memoranda Societatis pro Fauna et Flora Fennica 67, 147–149.
Li, Z., Yu, J., Yang, M., Zhang, J., Burch, M.D., Han, W., 2010. Cyanobacterial population and harmful metabolites dynamics during a bloom in yanghe reservoir, north China. Harmful Algae 9, 481–488. https://doi.org/10.1016/j.hal.2010.03.003
Liang, C., Wang, D., Yang, M., Sun, W., Zhang, S., 2005. Removal of eathy-must odorants in drinking water by powdered activated carbon. Journal of Environmental Science and Health 40, 767–778.
Llewellyn, L.E., Negri, A.P., Doyle, J., Baker, P.D., Beltran, E.C., Neilan, B.A., 2001. Radioreceptor assays for sensitive detection and quantitation of saxitoxin and its analogues from strains of the freshwater cyanobacterium, Anabaena circinalis. Environmental Science & Technology 35, 1445–1451. https://doi.org/10.1021/es001575z
Ludwig, F., Medger, A., Börnick, H., Opitz, M., Lang, K., Göttfert, M., Röske, I., 2007. Identification and expression analyses of putative sesquiterpene synthase genes in Phormidium sp. And prevalence of Geoa-like genes in a drinking water reservoir. Applied and Environmental Microbiology 73, 6988–6993. https://doi.org/10.1128/aem.01197-07
Lylloff, J.E., Mogensen, M.H., Burford, M.A., Schluter, L., Jorgensen, N.O.G., 2012. Detection of aquatic streptomycetes by quantitative PCR for prediction of taste-and-odour episodes in water reservoirs. Journal of Water Supply Research and Technology-Aqua 61, 272–282. https://doi.org/{10.2166/aqua.2012.006}
Marbun, Y.R., Yen, H.-K., Lin, T.-F., Lin, H.-L., Michinaka, A., 2012. Rapid on-site monitoring of cylindrospermopsin-producers in reservoirs using quantitative PCR. Sustainable Environment Research 22, 143–151.
Matsunaga, T., Takeyama, H., Nakayama, H., 2001. 16s rrna-targeted identification of cyanobacterial genera using oligonucleotide-probes immobilized on bacterial magnetic particles. Journal of Applied Phycology 13, 389–394. https://doi.org/10.1023/a:1017990518648
Morales, E.A., 2005. Observations of the morphology of some known and new fragilarioid diatoms (bacillariophyceae) from rivers in the USA. Phycological Research 53, 113–133. https://doi.org/10.1111/j.1440-183.2005.00378.x
Moustafa, A., Beszteri, B., Maier, U.G., Bowler, C., Valentin, K., Bhattacharya, D., 2009. Genomic footprints of a cryptic plastid Endosymbiosis in diatoms. Science 324, 1724–1726. https://doi.org/10.1126/science.1172983
Orsini, M., Romano-spica, V., 2001. A microwave-based method for nucleic acid isolation from environmental samples. Letters in Applied Microbiology 33, 17–20. https://doi.org/10.1046/j.1472-765x.2001.00938.x
Palenik, B., Haselkorn, R., 1992. multiple Evolutionary Origins of Prochlorophytes, the Chlorophyll B-containing Prokaryotes. nature 355, 265–267. https://doi.org/{10.1038/355265a0}
Pan, X., Chang, F., Liu, Y., Li, D., Xu, A., Shen, Y., Huang, Z., 2009. Mouse toxicity of Anabaena flos-aquae from Lake Dianchi, China. Environmental Toxicology 24, 10–18. https://doi.org/10.1002/tox.20385
Provasoli, L., Mclaughlin, J.j.a., Droop, M.r., 1957. The development of artificial media for marine algae. Archiv Für Mikrobiologie 25, 392–428. https://doi.org/10.1007/bf00446694
R Development Core Team, 2011. R: A language and environment for statistical computing. R Foundation for Statistical Computing, Vienna, Austria.
Rasmussen, J.p., Barbez, P.h., Burgoyne, L.a., Saint, C.p., 2008a. Rapid preparation of cyanobacterial dna for Real-time PCR analysis. Letters in Applied Microbiology 46, 14–19. https://doi.org/10.1111/j.1472-765x.2007.02252.x
Rasmussen, J.p., Giglio, S., Monis, P.t., Campbell, R.j., Saint, C.p., 2008b. Development and field testing of a Real-time PCR assay for cylindrospermopsin-producing cyanobacteria. Journal of Applied Microbiology 104, 1503–1515. https://doi.org/10.1111/j.1365-2672.2007.03676.x
Rasmussen, J., Saint, C., Monis, P., 2007. Use of dna melting simulation software for in silico diagnostic assay design: Targeting regions with complex melting curves and confirmation by Real-time PCR using intercalating dyes. Bmc Bioinformatics 8, 107. https://doi.org/10.1186/1471-2105-8-107
Rinta-kanto, J.M., Ouellette, A.J.A., Boyer, G.L., Twiss, M.R., Bridgeman, T.B., Wilhelm, S.W., 2005. Quantification of toxic Microcystis spp. During the 2003 and 2004 blooms in Western Lake Erie using Quantitative Real-time PCR. Environmental Science & Technology 39, 4198–4205. https://doi.org/10.1021/es048249u
Rippka, R., Deruelles, J., Waterbury, J.B., Herdman, M., Stanier, R.Y., 1979. Generic assignments, strain histories and properties of pure cultures of cyanobacteria. Journal of General Microbiology 111, 1–61. https://doi.org/10.1099/00221287-111-1-1
Ririe, K.M., Rasmussen, R.P., Wittwer, C.T., 1997. Product differentiation by analysis of dna melting curves during the polymerase chain reaction. Analytical Biochemistry 245, 154–160. https://doi.org/10.1006/abio.1996.9916
Rocap, G., Distel, D.L., Waterbury, J.B., Chisholm, S.W., 2002. Resolution of Prochlorococcus and Synechococcus ecotypes by using 16s-23s ribosomal dna internal transcribed spacer sequences. Applied and Environmental Microbiology 68, 1180–1191. https://doi.org/10.1128/aem.68.3.1180-1191.2002
Rodenacker, K., Gais, P., Jutting, U., Hense, B.A., 2001. (Semi-) automatic recognition of microorganisms in water. IEEE Signal Processing Soc; IEEE; IEEE, 345 E 47TH ST, NEW YORK, NY 10017 USA.
Saadoun, I., Schrader, K.K., Blevins, W.T., 2001. Identification of geosmin as a volatile metabolite of Anabaena sp. Memoranda Societatis Pro Fauna Et Flora Fennica 41, 51–55. https://doi.org/10.1002/1521-4028(200103)41:1<51::aid-jobm51>3.0.co;2-r
Sabour, B., Loudiki, M., Oudra, B., Vasconcelos, V., Oubraim, S., Fawzi, B., 2005. Dynamics and toxicity of anabaena aphanizomenoides (cyanobacteria) waterblooms in the shallow brackish oued mellah lake (morocco). Aquatic Ecosystem Health & Management 8, 95–104.
Shannon, C.E., Weaver, W., Blahut, R.E., Hajek, B., 1949. The mathematical theory of communication. University of Illinois press Urbana.
Sherr, E.B., Sherr, B.F., 1993. Preservation and storage of samples for enumeration of heterotrophic protists. Handbook of methods in aquatic microbial ecology. Lewis Publishers, Boca Raton 207–212.
Sotero-santos, R.B., Carvalho, E.G., Dellamano-oliveira, M.J., Rocha, O., 2008. Occurrence and toxicity of an Anabaena bloom in a tropical reservoir (southeast Brazil). Harmful Algae 7, 590–598. https://doi.org/10.1016/j.hal.2007.12.017
Steindler, L., Huchon, D., Avni, A., Ilan, M., 2005. 16s rrna phylogeny of sponge-associated cyanobacteria. Applied and Environmental Microbiology 71, 4127–4131. https://doi.org/10.1128/aem.71.7.4127-4131.2005
Wu, J., Jüttner, F., 1988. Differential partitioning of geosmin and 2-methylisoborneol between cellular constituents in Oscillatoria tenuis. Archives of Microbiology 150, 580–583. https://doi.org/10.1007/bf00408253
Xie, W.Q., Jäger, K., Potts, M., 1989. Cyanobacterial RNA polymerase genes \(rpoC_1\) and \(rpoC_2\) correspond to \(rpoC\) of escherichia coli. Journal of Bacteriology 171, 1967–1973.
Zhang, T., Li, L., Song, L., Chen, W., 2009. Effects of temperature and light on the growth and geosmin production of Lyngbya kuetzingii (cyanophyta). Journal of Applied Phycology 21, 279–285. https://doi.org/10.1007/s10811-008-9363-z