Establishment of quantitative PCR methods for the quantification of geosmin-producing potential and Anabaena sp. in freshwater systems
Supplementary Information
# These authors contributed equally to this work.
a Key Laboratory of Environmental Aquatic Chemistry, State Key Laboratory of Regional Environment and Sustainability, Research Center for Eco-Environmental Sciences, Chinese Academy of Sciences., Beijing 100085, China.
b University of Chinese Academy of Sciences., Beijing 100049, China.
c South Australia Water Corporation, Australian Water Quality Centre, Adelaide, SA 5000, Australia.
d Ecology, Evolution and Landscape Sciences, School of Earth and Environment Sciences, Adelaide University, Adelaide nil, Australia.
e Healthscope Pathology SA, Adelaide, SA 5034, Australia.
* Corresponding to: Min Yang (yangmin@rcees.ac.cn)
Figures and tables below provide supplementary evidence for the main text.
Field sites
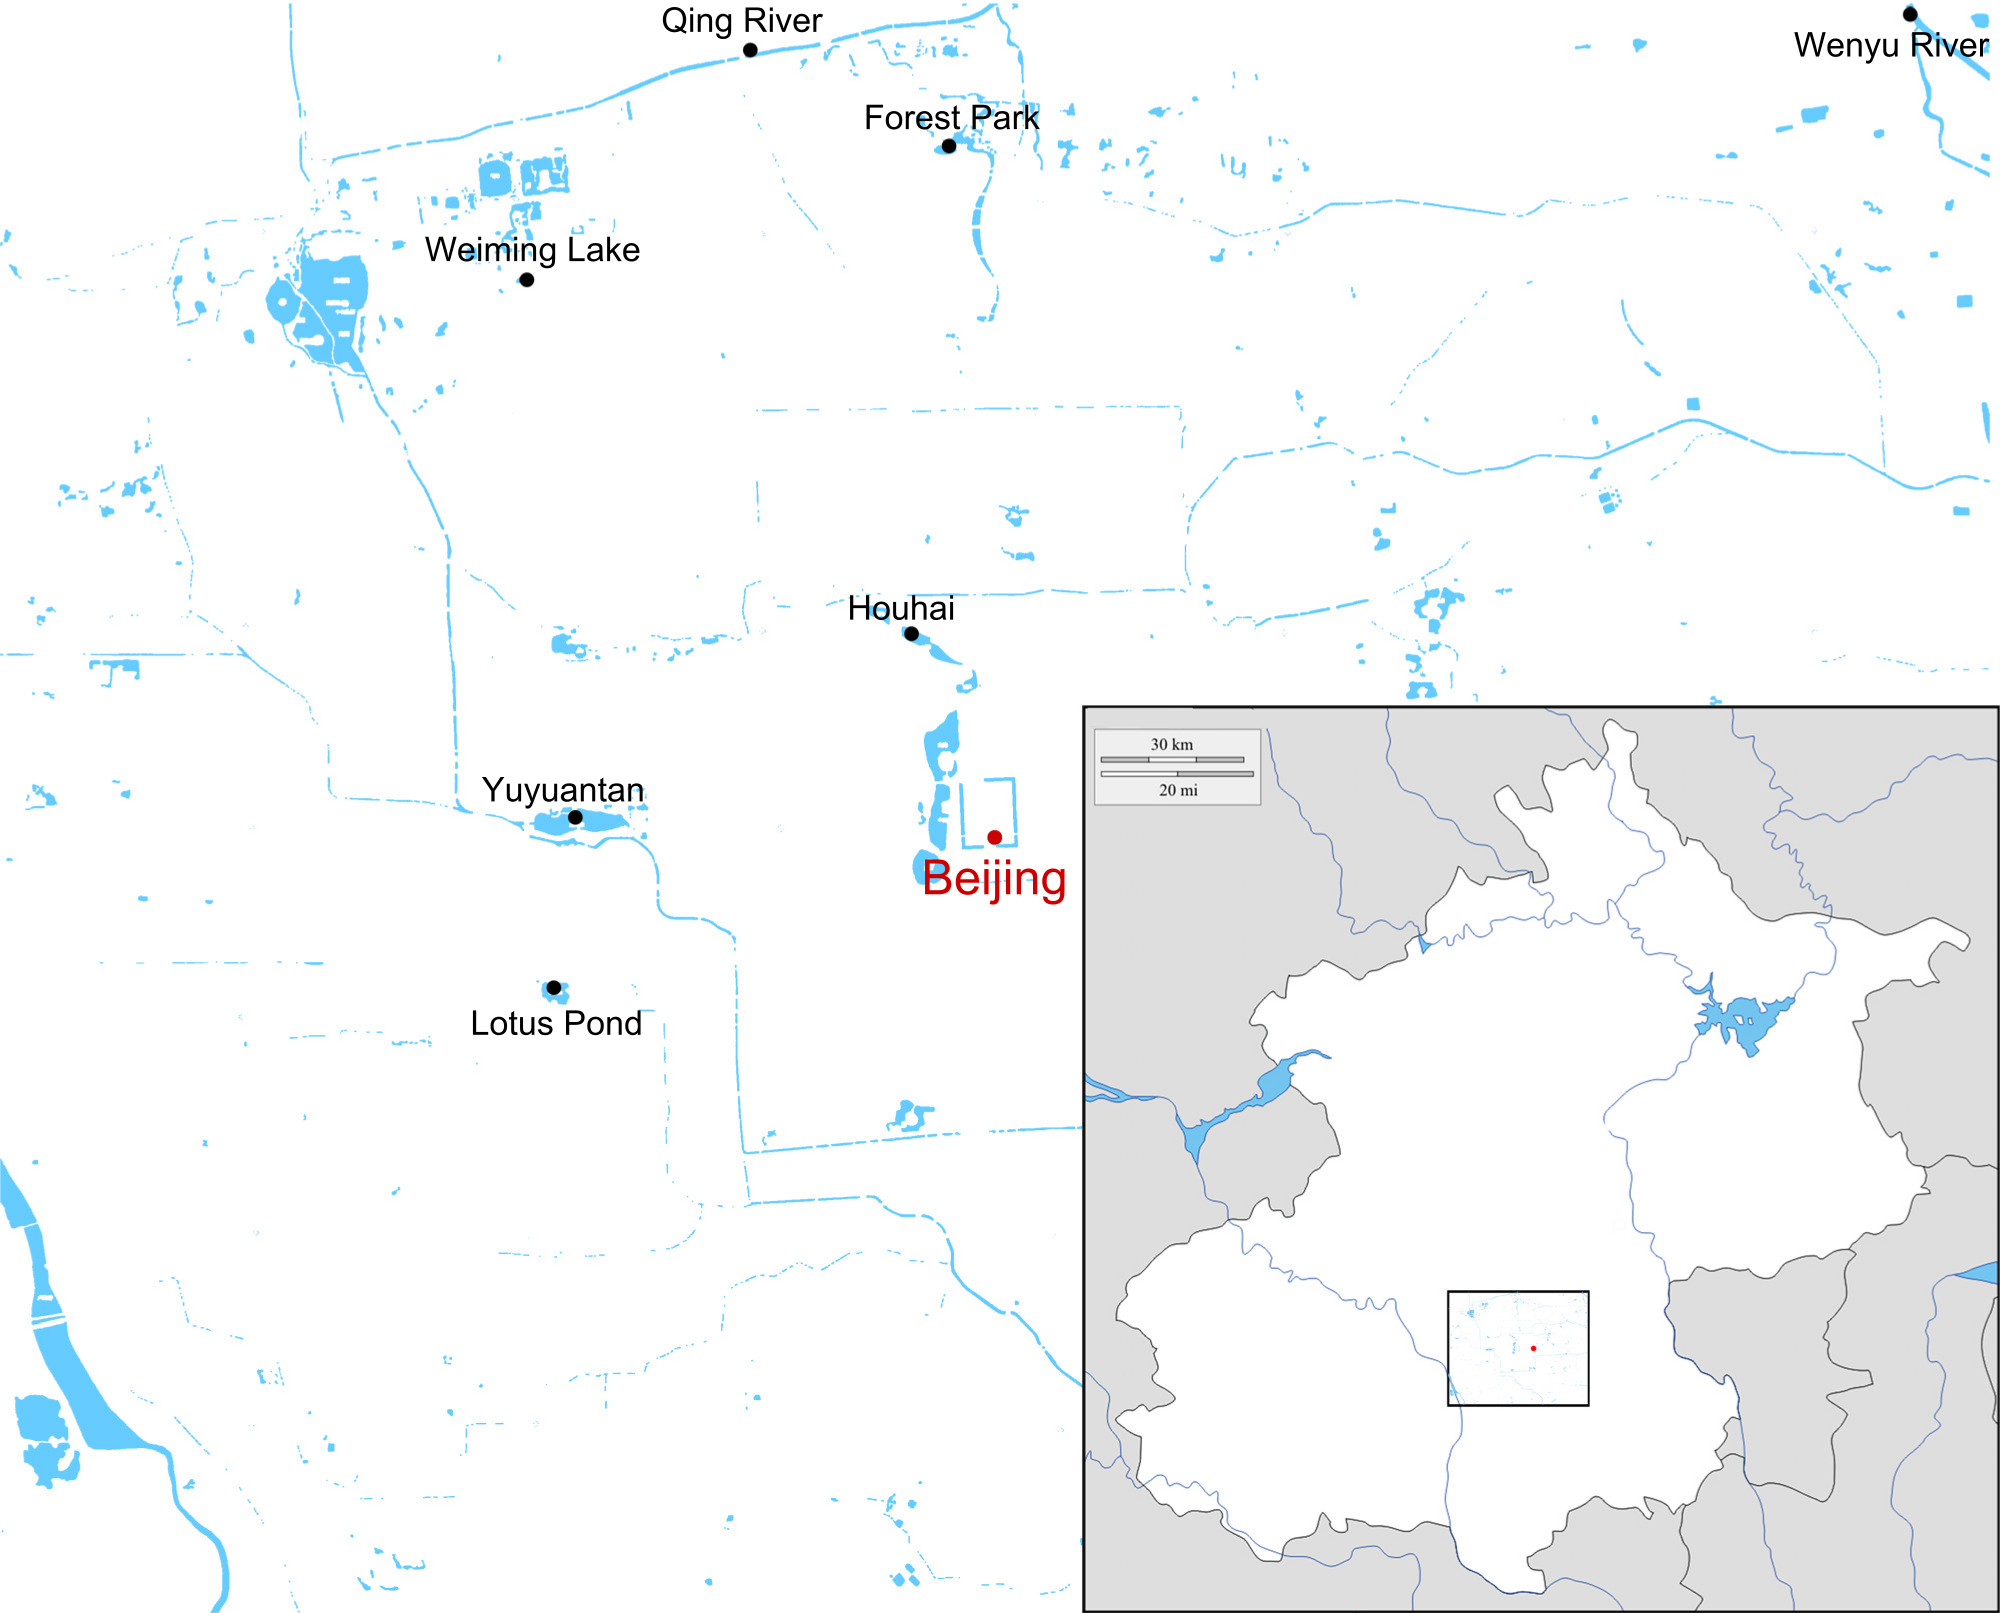
Seven sites were chosen to evaluate the applicability of the two qPCR assays. Five freshwater aquaculture ponds included Weiming Lake (WML), Forest Park (FP), Yuyuantan (YYT), Houhai (HH) and Lotus Ponds (LP), and two rivers were included: Wenyu River (WYR) and Qing River (QR), spread over five districts in Beijing, China (Fig. 1).
Geosmin component
The geosmin concentration of all culture samples collected during the simulated bloom was determined by GC-MS. Intracellular geosmin increased along with the bloom stage and cell density, whereas extracellular geosmin increased during the first seven weeks and then decreased to a low level. Intracellular geosmin concentrations ranged from \(1\times 10^2\) to \(1\times 10^5\) ng L\(^{-1}\). Most geosmin (83%-100%) was intracellular (Table 1).
| Date (day) | AE1 extra- | AE1 intra- | AE1 intra-portion | AE2 extra- | AE2 intra- | AE2 intra-portion |
|---|---|---|---|---|---|---|
| 1 | 4.9 | 191 | 97.50% | 15.3 | 906.4 | 98.34% |
| 4 | 87.5 | 423 | 82.86% | 73.1 | 2,150.7 | 96.71% |
| 6 | 9.0 | 799.8 | 98.89% | 25.5 | 4,200.9 | 99.40% |
| 8 | 73.0 | 1,323.3 | 94.77% | 232.5 | 8,955.7 | 97.47% |
| 13 | 190.0 | 4,867.4 | 96.24% | 294.6 | 31,874.4 | 99.08% |
| 16 | 32.4 | 11,498.4 | 99.72% | 237.3 | 30,616.3 | 99.23% |
| 20 | 161.1 | 25,131.5 | 99.36% | 1,312.4 | 42,078.8 | 96.98% |
| 23 | 428.6 | 17,993.2 | 97.67% | 2,043.3 | 18,556.4 | 90.08% |
| 27 | 729.5 | 26,197.0 | 97.29% | 2,783.0 | 18,643.0 | 87.01% |
| 30 | 527.0 | 79,501.8 | 99.34% | 2,416.2 | 73,727.4 | 96.83% |
| 36 | 2,381.0 | 104,830.0 | 97.78% | 1,365.1 | 88,458.5 | 98.48% |
| 44 | 10,138.0 | 82,235.5 | 89.02% | 5,493.8 | 69,928.2 | 92.72% |
| 51 | 384.5 | 67,369.8 | 99.43% | 6,235.7 | 77,520.6 | 92.55% |
| 57 | 56.7 | 82,066.6 | 99.93% | 248.2 | 37,136.9 | 99.34% |
| 65 | 299.5 | 163,120.5 | 99.82% | 582.6 | 111,916.5 | 99.48% |
| 72 | 19.1 | 174,100.7 | 99.99% | 69.2 | 116,592.6 | 99.94% |
Primer specificity
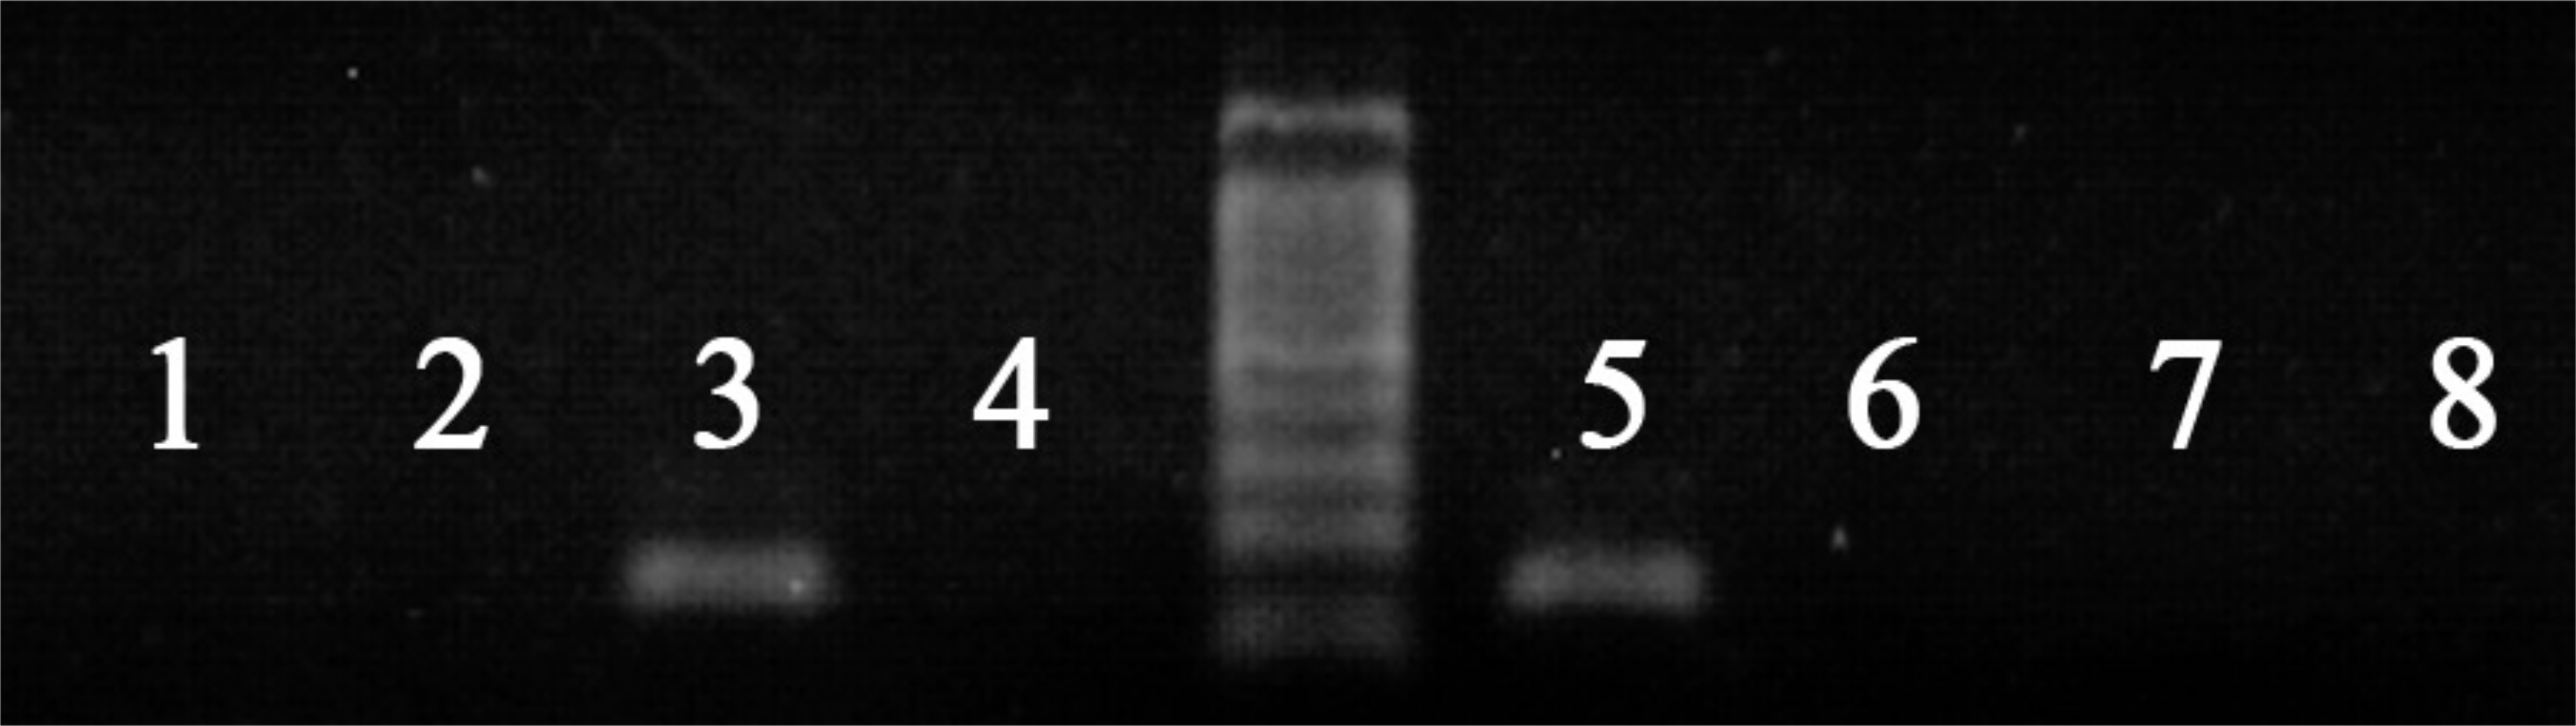
Genomic DNA from 30 Anabaena strains and 17 other strains was tested with the ARG primers AN03/06 by conventional PCR and gel electrophoresis. The available electrophoresis results are shown in Fig. 2.

The specificity of GSG primers 173AF/AR was tested using conventional PCR with seven Anabaena strains and one Microcystis strain, coupled with gel electrophoresis (Fig. 3). GC-MS comparisons indicated that the primers amplified GSG in geosmin-producing Anabaena strains.
Validation on field samples
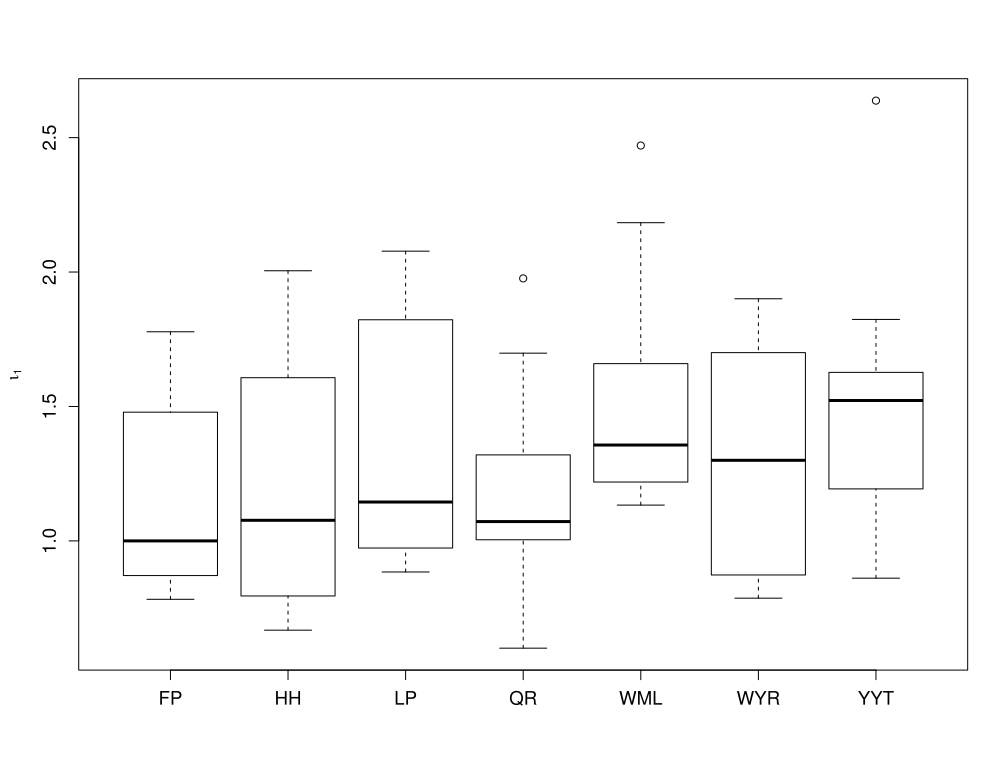
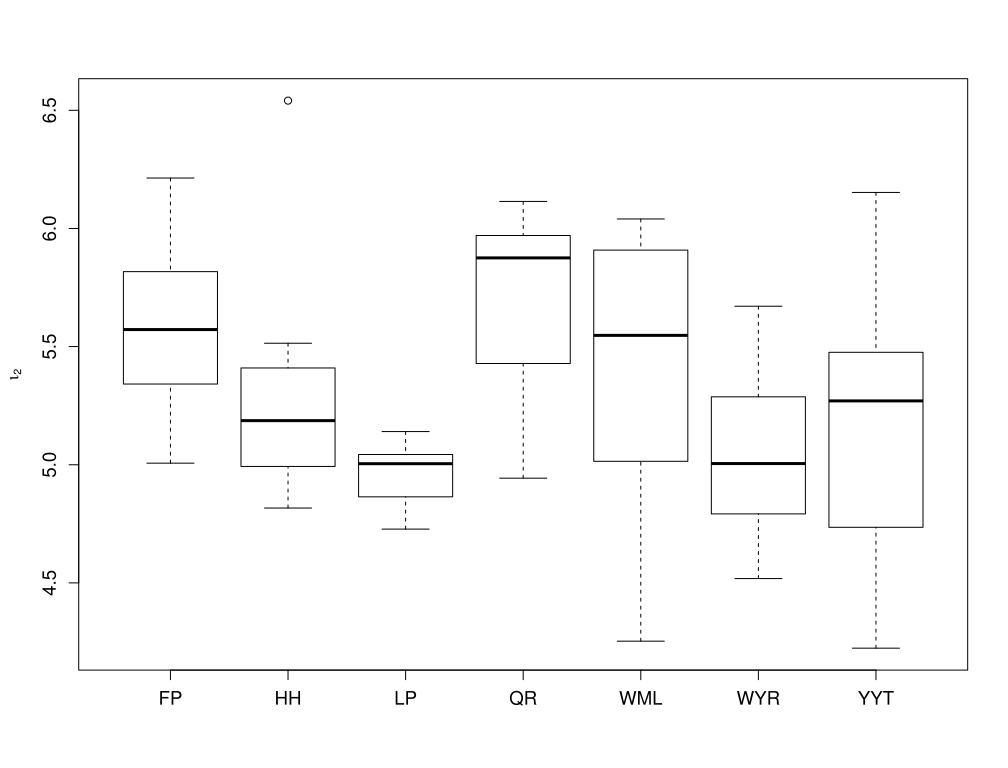
The 63 field samples used to validate the two qPCR assays were spiked with different concentrations of FADC-0001 (Anabaena spiroides) cells. Two ANOVA tests evaluated the effects of background biomass. The logarithmic ARG copy density normalized by cell density ranged from 1.17 (FP) to 1.54 (QR) (Fig. 4). The site effect was not significant (F=1.003, p=0.43). The logarithmic GSG copy density normalized by intracellular geosmin ranged from 4.96 (QR) to 5.7 (WML) (Fig. 5), with no significant site effect (F=2.27, p=0.053).
Extracellular geosmin and GSG density
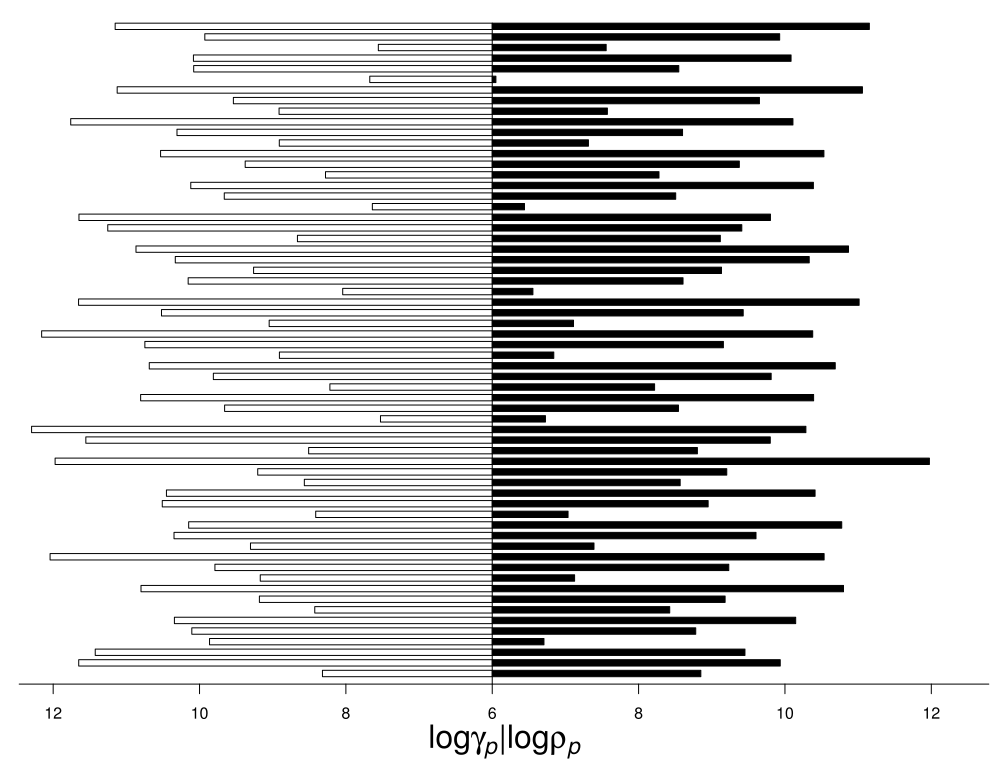
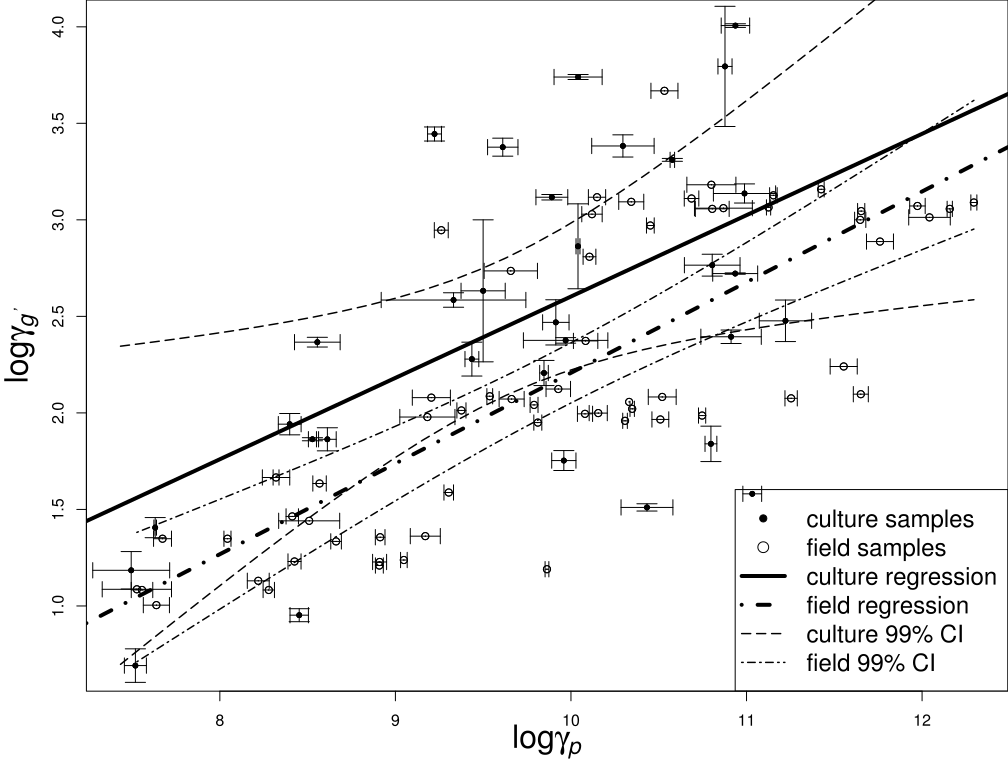
The GSG density of 32 culture samples and 63 field samples was compared with geosmin concentration measured by GC-MS. The intracellular geosmin concentration was more closely related to GSG density than extracellular geosmin. Fig. 6 shows the comparison with extracellular geosmin. The log-log regressions for culture and field samples were:
\[ \begin{aligned} \gamma_p &= 0.4214\gamma_{g'} - 1.114 \quad (r^2=0.253,\ p<0.01)\\ \gamma_p &= 0.4697\gamma_{g'} - 2.490 \quad (r^2=0.622,\ p<0.01) \end{aligned} \tag{1}\]
Here, \(\gamma_p\) is GSG copy number and \(\gamma_{g'}\) is extracellular geosmin concentration. The two regression lines are shown in Fig. 6.
ARG and GSG density in field samples
The ARG and GSG densities showed high consistency in both culture and field samples, although they were amplified separately (Fig. 7).